Get Certified for Financial Modeling (FMVA)®
Gain in-demand industry knowledge and hands-on practice that will help you stand out from the competition and become a world-class financial analyst.
The mean value of an inventory during a determined period of time
The average inventory is the mean value (that can be different from the median value) of an inventory during a determined period of time. The average inventory is thus a mathematical calculation. It estimates, on average, the value or the number of goods stored.
Below is the formula for calculating the average inventory:
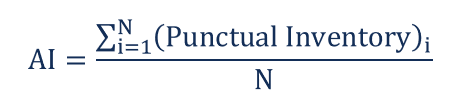
Where:
Before explaining what the average inventory is used for and its benefits, let us give a basic definition of inventory. Inventory is the total of all the goods ready to be sold and all the raw materials stored in the warehouse of a given company.
Usually, the inventory balance is measured on the last business day of each month. Thus, the average inventory is usually calculated for a time longer than one month, like a trimester or a year. Punctual inventory is the inventory balance for each month.
The average inventory can be used for different purposes. The two most common uses are for comparing sales or revenue.
On the one hand, comparing the average inventory across two periods can reveal fluctuations due to increases or decreases in sales. On the other hand, the average inventory helps determine the level of inventory the company needs to invest in to generate a given level of revenue.
Moreover, tracking average inventory helps the company determine whether it incurred losses in raw materials or stored goods due to inaccuracies, theft, or warehouse accidents.
In the previous paragraph, we saw how the average inventory could be useful in many circumstances; however, it comes with a few drawbacks.
Using an average estimation instead of a punctual one, you may not detect high volatility, which is important to eliminate (i.e., running out of inventory). For example, common practice allows the calculation to be based on a month-end inventory balance, but it can be very different if calculated on a day-end inventory balance.
Another problem arises if the average inventory is used to calculate the business trend in the year-to-date calculation. If the sales are seasonal, it can lead to a skewed distribution that can be misleading.
Lastly, there is a problem in common practice. Most of the time, the month-end inventory value is estimated instead of measured. Estimated values can come with errors that will be reported and amplified when calculating the average inventory.
It is necessary to keep in mind all these pitfalls every time we use the average inventory data.
The owner of a local supermarket wants to know whether the average inventory for the first semester of 2019 is consistent with the average inventory calculated for the first quarter of the year. The average inventory for the first quarter was $10,000. It means that, on average, the value stored in the supermarket warehouse in January 2019 was $10,000. The same value applied for February 2019 and March 2019.
If we want to calculate the average inventory for the first semester, we need the month-end inventory for April, May, and June 2019. The warehouse manager registered the following value:
If we apply the formula, the average inventory for the first semester results to be:

The average inventory for the semester is the same as that for the first quarter of the year. This means the sales are quite stable and volatility is very low.
Connect what you just learned to a clear career path with CFI’s role‑based courses and certification programs.
In order to help you become a world-class financial analyst and advance your career to your fullest potential, these additional resources will be very helpful:


