CVP Analysis Guide

Cost, Volume, Profit

Over 1.8 million professionals use CFI to learn accounting, financial analysis, modeling and more. Start with a free account to explore 20+ always-free courses and hundreds of finance templates and cheat sheets.

What is CVP Analysis?

Cost-Volume-Profit Analysis (CVP analysis), also commonly referred to as Break-Even Analysis, is a way for companies to determine how changes in costs (both variable and fixed) and sales volume affect a company’s profit. With this information, companies can better understand overall performance by looking at how many units must be sold to break even or to reach a certain profit threshold or the margin of safety.

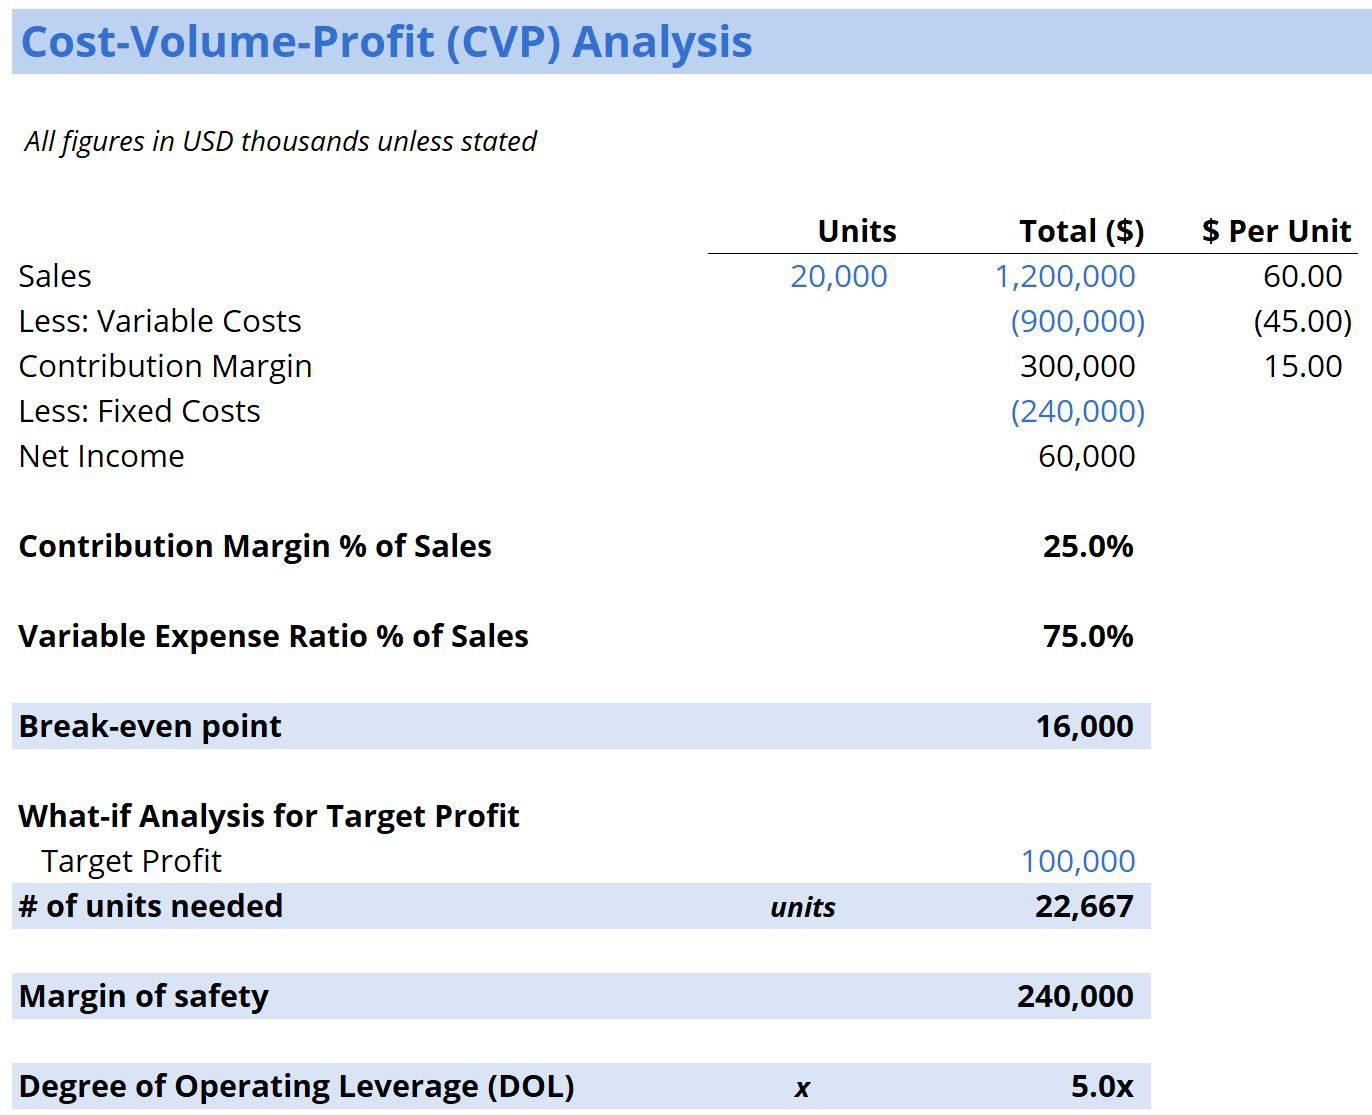
CVP Analysis Template Screenshot

To learn more, launch our financial modeling courses!

Components of CVP Analysis

There are several different components that together make up CVP analysis.  These components involve various calculations and ratios, which will be broken down in more detail in this guide.

The main components of CVP analysis are:

  1. CM ratio and variable expense ratio
  2. Break-even point (in units or dollars)
  3. Margin of safety
  4. Changes in net income
  5. Degree of operating leverage

In order to properly implement CVP analysis, we must first take a look at the contribution margin format of the income statement.

CVP Analysis Setup

The regular income statement follows the order of revenues minus cost of goods sold and gives gross margin, while revenues minus expenses lead to net income. A contribution margin income statement follows a similar concept but uses a different format by separating fixed and variable costs.

The contribution margin is the product’s selling price, less the variable costs associated with producing that product. The value can be given in total dollars or per unit.

Contribution Margin (CM) Income Statement Example:

Consider the following example in order to calculate the five important components listed above.

XYZ Company has the following contribution margin income statement:

TotalPer Unit
Sales (20,000 units)$1,200,000$60
Less: Variable costs-$900,000-$45
Contribution Margin$300,000$15
Less: Fixed costs-$240,000
Net income $60,000

#1 CM Ratio and Variable Expense Ratio

CM ratios and variable expense ratios are numbers that companies generally want to see to get an idea of how significant variable costs are.

CM Ratio = Contribution Margin / Sales

Variable Expense Ratio = Total Variable Costs / Sales

A high CM ratio and a low variable expense ratio indicate low levels of variable costs incurred.


#2 Break-Even Point

The break-even point (BEP), in units, is the number of products the company must sell to cover all production costs. Similarly, the break-even point in dollars is the amount of sales the company must generate to cover all production costs (variable and fixed costs).

The formula for break-even point (BEP) is:

BEP =Total Fixed Costs /  CM per Unit

The BEP, in units, would be equal to 240,000/15 = 16,000 units. Therefore, if the company sells 16,000 units, the profit will be zero and the company will “break even” and only cover its production costs.

#3 Changes in Net Income (What-if Analysis)

It is quite common for companies to want to estimate how their net income will change with changes in sales behavior. For example, companies can use sales performance targets or net income targets to determine their effect on each other.

In this example, if management wants to earn a profit of at least $100,000, how many units must the company sell?

We can apply the appropriate what-if formula below:

No. of units = (Fixed Costs + Target Profit) / CM Ratio

Therefore, to earn at least $100,000 in net income, the company must sell at least 22,666 units.

To learn more, launch our financial modeling courses!

#4 Margin of Safety

In addition, companies may also want to calculate the margin of safety. This is commonly referred to as the company’s “wiggle room” and shows by how much sales can drop and yet still break even.

The formula for the margin of safety is:

Margin of Safety = Actual Sales – Break-even Sales

The margin of safety in this example is:

Actual Sales – Break-even Sales = $1,200,000 – 16,000*$60 = $240,000

This margin can also be calculated as a percentage in relation to actual sales: 240,000/1,200,000 = 20%.

Therefore, sales can drop by $240,000, or 20%, and the company is still not losing any money.


#5 Degree of Operating Leverage (DOL)

Finally, the degree of operating leverage (DOL) can be calculated using the following formula:

DOL = CM / Net Income

So, the DOL in this example is $300,000 / 60,000 = 5.

The DOL number is an important number because it tells companies how net income changes in relation to changes in sales numbers. More specifically, the number 5 means that a 1% change in sales will cause a magnified 5% change in net income.

Many might think that the higher the DOL, the better for companies. However, the higher the number, the higher the risk, because a higher DOL also means that a 1% decrease in sales will cause a magnified, larger decrease in net income, ultimately decreasing its profitability.

CVP Analysis and Decision Making

Putting all the pieces together and conducting the CVP analysis, companies can then make decisions on whether to invest in certain technologies that will alter their cost structures, and determine the effects on sales and profitability much quicker.

For example, let’s say that XYZ Company from the previous example was considering investing in new equipment that would increase variable costs by $3 per unit but could decrease fixed costs by $30,000. In this decision-making scenario, companies can easily use the numbers from the CVP analysis to determine the best answer.

The hardest part in these situations involves determining how these changes will affect sales patterns – will sales remain relatively similar, will they go up, or will they go down? Once sales estimates become somewhat reasonable, it then becomes just a matter of number crunching and optimizing the company’s profitability.

Download the Free Template

Enter your name and email in the form below and download the free template now!

Additional Resources

Thank you for reading CFI’s guide to CVP Analysis. To keep learning and developing your knowledge base, please explore the additional relevant resources below:

Free Accounting Courses

Learn accounting fundamentals and how to read financial statements with CFI’s free online accounting classes.
These courses will give the confidence you need to perform world-class financial analyst work. Start now!


Building confidence in your accounting skills is easy with CFI courses! Enroll now for FREE to start advancing your career!

0 search results for ‘