
Get In-Demand Finance Certifications
Expected Loss (EL) is a key metric used in credit risk analysis, offering financial institutions a reliable way to estimate potential losses across their lending portfolios. By combining statistical insights with historical data, EL helps banks maintain financial stability, meet regulatory requirements, and optimize risk-based strategies.
Expected Loss helps banks estimate average anticipated losses across portfolios of similar loans. Unlike credit scoring models used for individual loan decisions, EL provides a broader view of potential losses at the portfolio level. This broader view helps banks maintain appropriate capital reserves and develop effective risk management strategies.
Three key components work together to quantify average losses across groups of similar loans:
Every lending decision starts with a fundamental question: what are the chances this borrower won’t repay? Probability of Default (PD) is the credit risk metric that provides the answer.
PD measures the likelihood that a borrower will default on their obligations within a specific timeframe. For example, if a borrower has a PD of 2%, there’s a 2% chance they’ll default within the next year.
Banks use sophisticated systems to calculate PD through multiple approaches, including:
When evaluating these ratings, banks examine both quantitative data, like financial ratios, and qualitative factors, like market position and industry conditions. This comprehensive approach helps create more accurate PD estimates.
When default occurs, banks rarely lose everything. Loss Given Default (LGD) represents the percentage of exposure a lender expects to lose if a default occurs. For example, if a loan of $100,000 defaults, and the bank expects to recover $40,000, the LGD would be 60%.
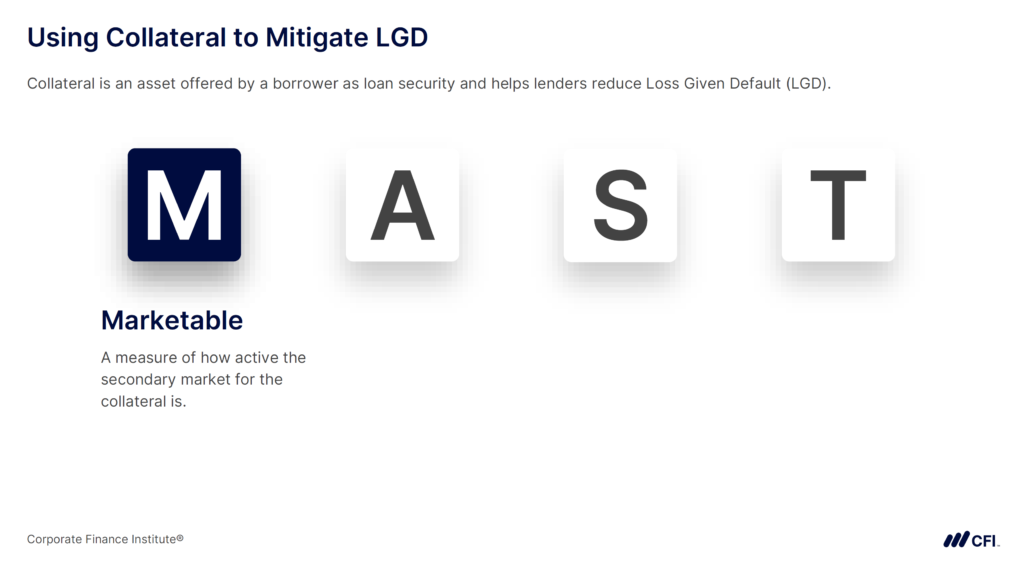
The quality of collateral plays a crucial role in determining LGD. Banks assess collateral quality using the MAST framework:
Understanding LGD helps banks structure loans more effectively. For instance, they might require more collateral for borrowers with higher PDs or adjust loan terms based on collateral quality.
When defaults occur, banks need to understand exactly how much money is at risk. Exposure at Default (EAD) quantifies the total value exposed to loss at the time of default. It is a critical component of credit risk analysis, forming part of the Expected Loss (EL) calculation alongside Probability of Default (PD) and Loss Given Default (LGD).
The structure of a loan significantly impacts EAD. For term loans, this might be the outstanding balance. For credit facilities, it includes both drawn amounts and potential future drawings. Consider these common credit scenarios:
The table below summarizes the components of Expected Loss (EL) and their relationships:
| Probability of Default (PD | Likelihood of borrower defaulting | |
| Loss Given Default (LGD) | % of loss if default occurs | |
| Exposure at Default (EAD) | Total value at risk during default | |
| Expected Loss (EL) | Average anticipated loss across portfolio |
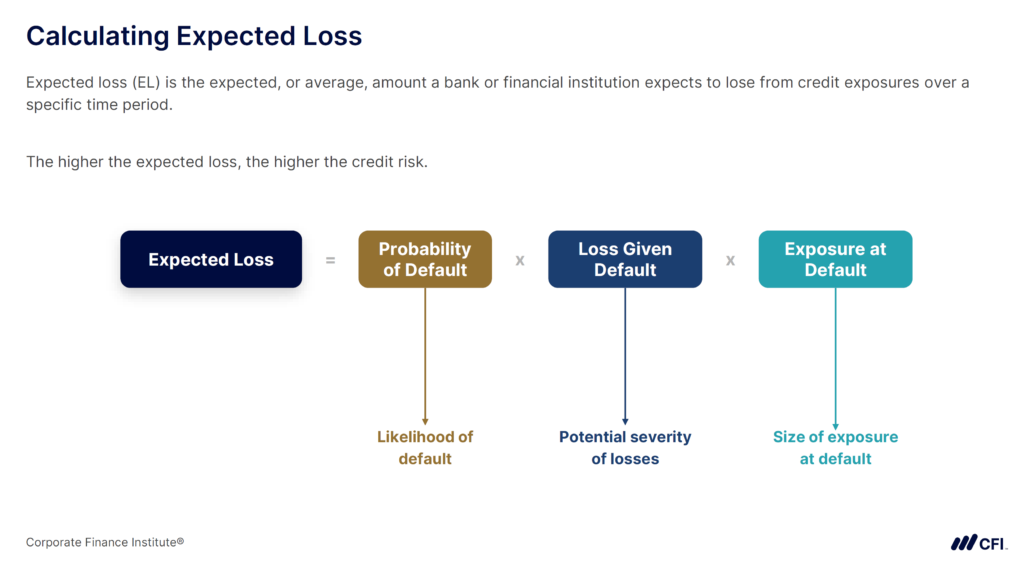
The Expected Loss formula provides an estimate of average losses across a portfolio:
For example, consider a portfolio of similar commercial loans:
Expected Loss (EL) = 2% × 40% × $10,000,000 = $80,000
Interpretation: With a 2% likelihood of default (PD), an average loss of 40% when defaults occur (LGD), and a total exposure of $10 million (EAD), this portfolio’s expected loss (EL) is $80,000 annually. This tells us that the bank anticipates losing $80,000 each year on average for this portfolio type.
Basel III compliance drives much of the practical application of Expected Loss calculations. This international regulatory framework requires banks to maintain specific capital reserves proportional to their risk exposure.
By calculating Expected Loss across portfolios, banks can determine appropriate capital levels that satisfy these regulatory requirements while maintaining efficient use of capital. This ensures financial stability while allowing banks to continue lending profitably.
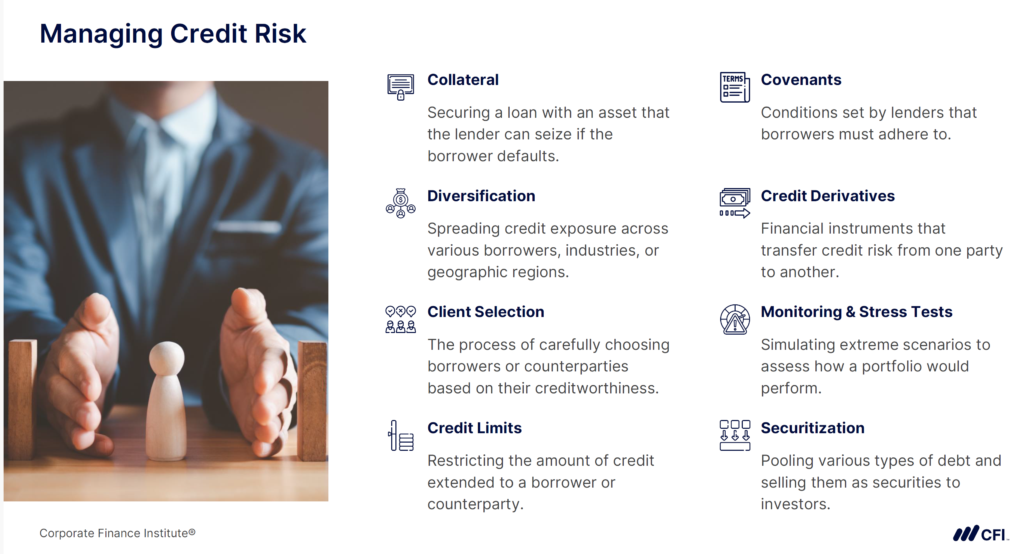
Credit risk analysis, which includes calculating EL, helps banks enhance returns by identifying borrowers and sectors that offer the best balance of risk and reward. EL quantifies potential losses, enabling financial institutions to implement targeted risk mitigation strategies such as:
Example in Practice:
Imagine a bank discovers through stress testing that its energy sector portfolio has an EL of $10 million due to volatile oil prices. To mitigate this risk, the bank might:
Effective portfolio management requires balancing risk and reward across a wide range of loans and investments. EL provides a quantitative framework for this process by aggregating the estimated risk for the entire portfolio. Key applications include:
Example in Practice:
For instance, if EL calculations reveal increased risk for loans to small businesses during a recession, a bank may:
This dynamic approach ensures the portfolio remains resilient while maintaining profitability.
Expected loss (EL) is a fundamental concept in credit risk analysis. Calculating EL entails multiplying probability of default, loss given default, and exposure at default to quantify potential losses. Financial institutions use EL to help them make better lending decisions, allocate capital efficiently, and manage their credit risk exposure effectively. For risk professionals, mastering EL calculation and interpretation is crucial for developing robust risk management frameworks.
Ready to deepen your knowledge of risk management? CFI’s Risk Management Specialization provides a hands-on program equipping you with the practical skills needed to create effective risk strategies and navigate complex regulatory environments.
Explore the Risk Management Specialization!
Credit Risk Analyst Career Profile


