Get Certified for
Business Intelligence (BIDA®)
Develop analytical superpowers by learning how to use programming and data analytics tools such as VBA, Python, Tableau, Power BI, Power Query, and more.
A measure of the relationship between random variables
In mathematics and statistics, covariance is a measure of the relationship between two random variables. The metric evaluates how much, or to what extent, the variables change together. In other words, it is essentially a measure of the variance between two variables. However, the metric does not assess the dependency between variables.

Unlike the correlation coefficient, covariance is measured in units. The units are computed by multiplying the units of the two variables. The variance can take any positive or negative values. The values are interpreted as follows:
In finance, the concept is primarily used in portfolio theory. One of its most common applications in portfolio theory is diversification, which uses the covariance between assets in a portfolio. By choosing assets that do not exhibit a high positive covariance with each other, the unsystematic risk can be partially eliminated.
CFI’s Math for Corporate Finance Course explores the financial mathematics concepts required for Financial Modeling.
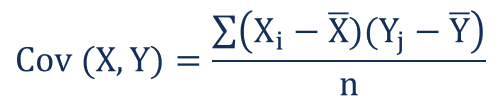
The covariance formula is similar to the formula for correlation and deals with the calculation of data points from the average value in a dataset. For example, the covariance between two random variables X and Y can be calculated using the following formula (for a population):
For a sample covariance, the formula is slightly adjusted:
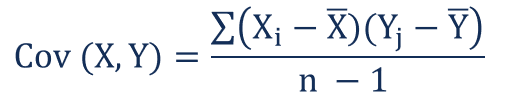
Where:
Covariance and correlation both primarily assess the relationship between variables. The closest analogy to the relationship between them is the relationship between the variance and standard deviation.
Covariance measures the total variation of two random variables from their expected values. Using covariance, we can only gauge the direction of the relationship (whether the variables tend to move in tandem or show an inverse relationship). However, it does not indicate the strength of the relationship, nor the dependency between the variables.
On the other hand, correlation measures the strength of the relationship between variables. Correlation is the scaled measure of covariance. It is dimensionless. In other words, the correlation coefficient is always a pure value and not measured in any units.
The relationship between the two concepts can be expressed using the formula below:
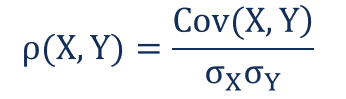
Where:
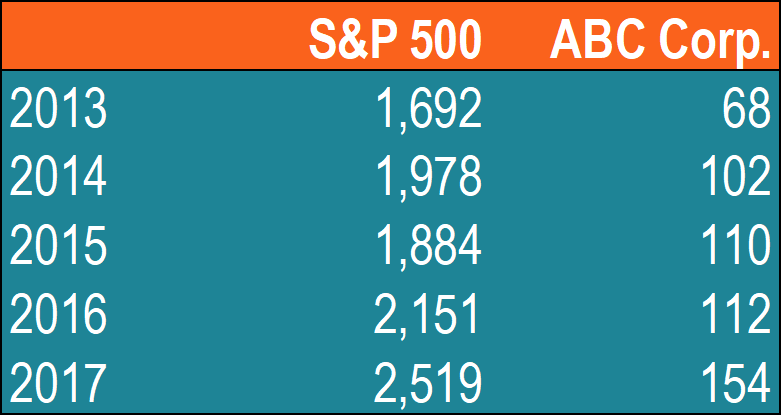
John is an investor. His portfolio primarily tracks the performance of the S&P 500 and John wants to add the stock of ABC Corp. Before adding the stock to his portfolio, he wants to assess the directional relationship between the stock and the S&P 500.
John does not want to increase the unsystematic risk of his portfolio. Thus, he is not interested in owning securities in the portfolio that tend to move in the same direction.
John can calculate the covariance between the stock of ABC Corp. and S&P 500 by following the steps below:
1. Obtain the data.
First, John obtains the figures for both ABC Corp. stock and the S&P 500. The prices obtained are summarized in the table below:
2. Calculate the mean (average) prices for each asset.
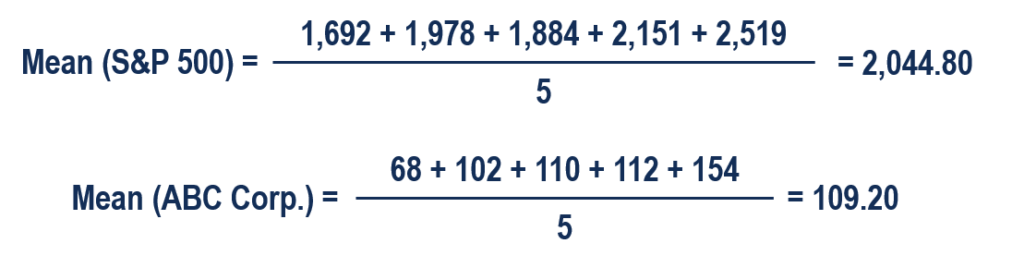
3. For each security, find the difference between each value and mean price.
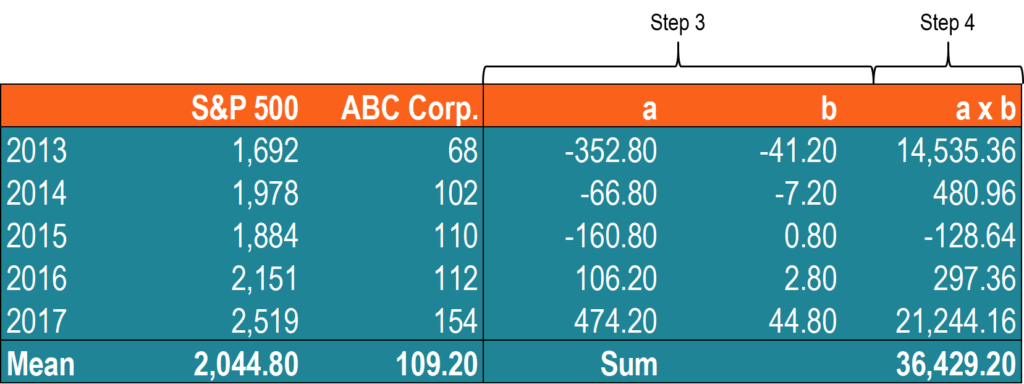
4. Multiply the results obtained in the previous step.
5. Using the number calculated in step 4, find the covariance.

In such a case, the positive covariance indicates that the price of the stock and the S&P 500 tend to move in the same direction.
Connect what you just learned to a clear career path with CFI’s role‑based courses and certification programs.
To keep learning and advancing your career, the following CFI resources will be helpful:


