Price Ceiling

A limit on the price of a good or service imposed by the government to protect consumers

Over 1.8 million professionals use CFI to learn accounting, financial analysis, modeling and more. Start with a free account to explore 20+ always-free courses and hundreds of finance templates and cheat sheets.

What is a Price Ceiling?

A price ceiling is a limit on the price of a good or service imposed by the government to protect consumers by ensuring that prices do not become prohibitively expensive. For the measure to be effective, the price set by the price ceiling must be below the natural equilibrium price.

Price Ceiling - Businessman holding transparent with the words price ceiling inscribed on it

Rationale Behind a Price Ceiling

A price ceiling creates deadweight loss – an ineffective outcome. Although deadweight loss is created, the government establishes a price ceiling to protect consumers. An example of a price ceiling in the United States is rent control.

Rent Control in New York City

After World War II, soldiers were returning home from years of combat to start families. The influx of returning soldiers created a high demand for housing. Due to the high demand, landlords increased the price of rent to match the surge in demand.

However, the higher cost of renting resulted in unaffordable housing for soldiers returning from the war, especially since many were no longer receiving military pay. To address the problem, the government established a ceiling for rent charged to ensure that soldiers could find affordable housing in New York.

Although they are used to promote fairness and protect consumers, price ceilings that are set too low below the equilibrium price can be disastrous for producers. Unrealistic ceilings can destroy businesses and create an economic crisis.

Implications of a Price Ceiling

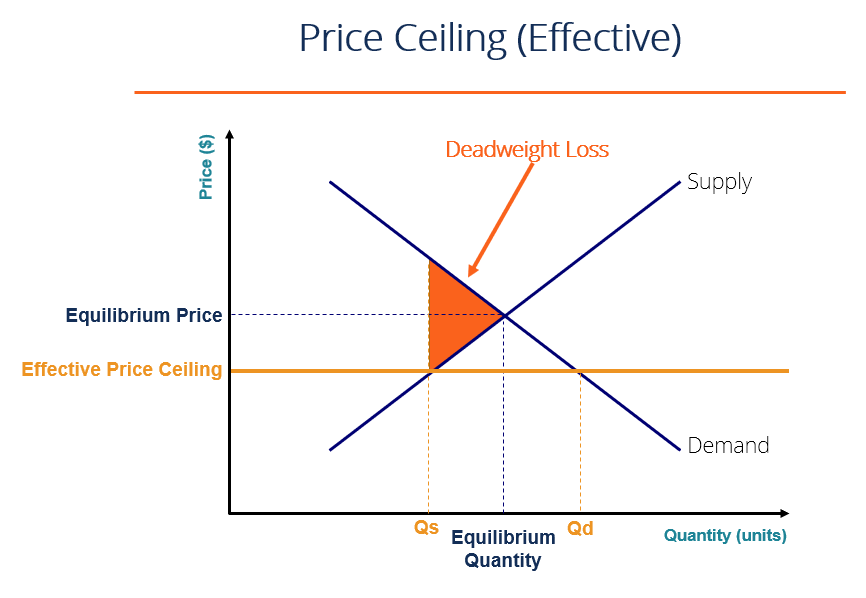
When an effective price ceiling is set, excess demand is created coupled with a supply shortage – producers are unwilling to sell at a lower price and consumers are demanding cheaper goods. Therefore, deadweight loss is created. If the demand curve is relatively elastic, consumer surplus will be net positive while the change in producer surplus is negative.

Graphical Representation of an Effective Price Ceiling

Graphical Representation of an Effective Price Ceiling

For the measure to be effective, the ceiling price must be below that of the equilibrium price. The ceiling price is binding and causes the equilibrium quantity to change – quantity demanded increases while quantity supplied decreases. It causes a quantity shortage of the amount Qd – Qs. In addition, a deadweight loss is created from the price ceiling.

Graphical Representation of an Ineffective Price Ceiling

Ineffective Price Ceiling

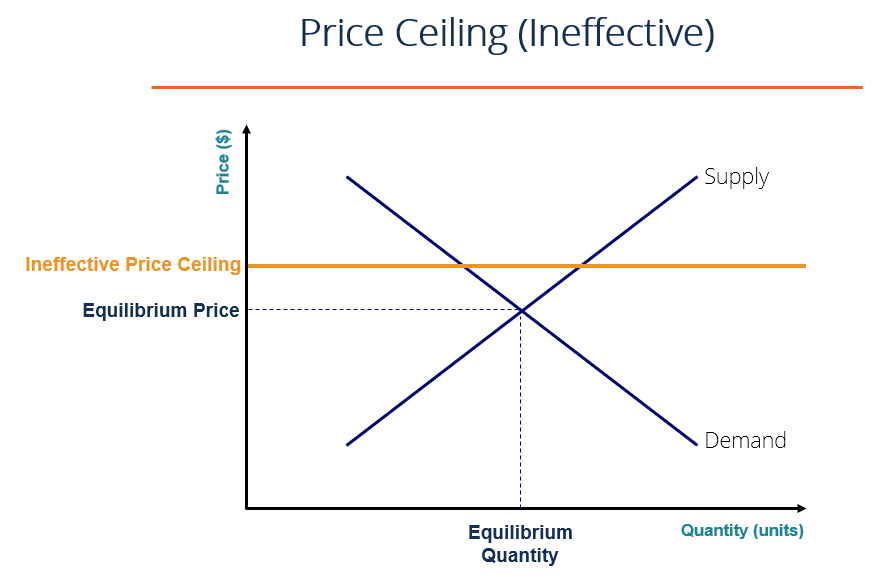
A price ceiling is said to be ineffective if it does not change the choices of market participants. As illustrated above, an ineffective (price) ceiling is created when the ceiling price is above the equilibrium price. Since the ceiling price is above the equilibrium price, natural equilibrium still holds, no quantity shortages are created, and no deadweight loss is created.

Practical Example of a Price Ceiling

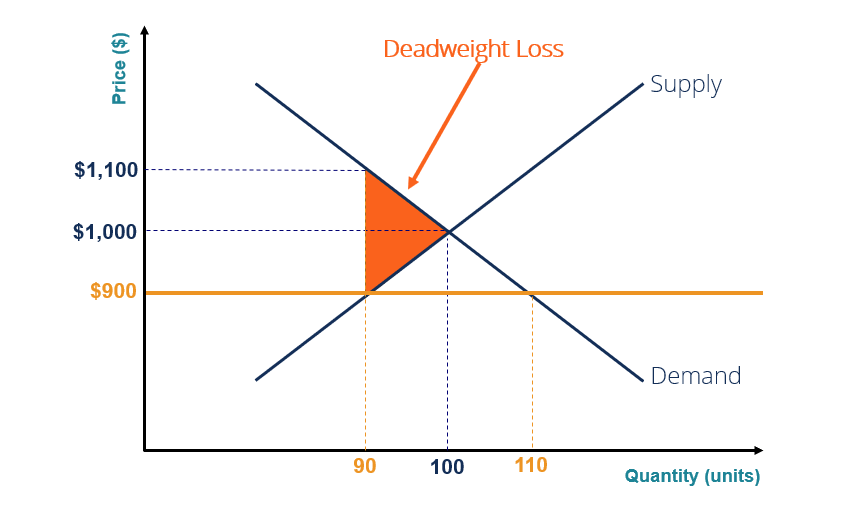
In equilibrium, the price of rent is $1,000 with a quantity of 100. Due to the extremely high demand for rental housing, the government decided to regulate the situation by imposing a price ceiling of $900.

At the ceiling price of $900, quantity demanded is 110 while quantity supplied is 90. The price demanded at the quantity of 90 is $1,100. Determine the deadweight loss created by the price ceiling and the quantity shortage.

Practical Example of a Price Ceiling

Deadweight loss created is illustrated by the triangle above and is calculated as 0.5 x (($1,100 –  $900) x (100 – 90)) = 1,000 in deadweight loss created.

Quantity shortage is the difference between quantity demanded and quantity supplied and is calculated as 110 – 90 = 20 quantity shortage.

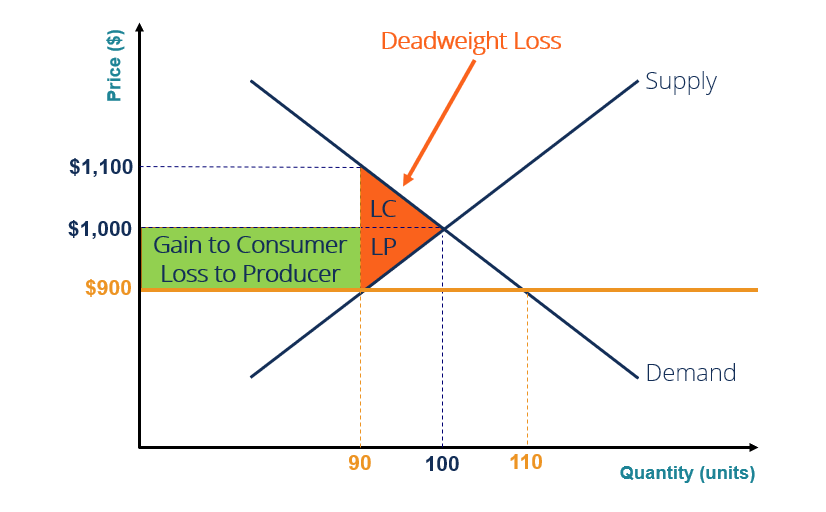
Gains/Losses is the change in surplus for consumers and producers and is illustrated graphically below. Both consumers and producers lose; it is illustrated by the deadweight loss (LC – loss to consumers; LP – loss to producers).

However, consumers face a net gain because the price ceiling has caused a shift in producer surplus to consumer surplus (illustrated by the green rectangle). Therefore, in our example:

  • Consumers gain: Consumers lose LC but gain the green rectangle.
  • Producers lose: Producers lose LP and also lose the green rectangle.

Example of Deadweight Loss

Related Reading

CFI is the official provider of the global Financial Modeling & Valuation Analyst (FMVA)® certification program, designed to help anyone become a world-class financial analyst. To keep advancing your career, the additional CFI resources below will be useful:

Financial Analyst Certification

Become a certified Financial Modeling and Valuation Analyst (FMVA)® by completing CFI’s online financial modeling classes!

0 search results for ‘