Advance-Decline Line
A technical indicator that plots the difference between the number of advancing stocks to declining stocks on a daily basis
What is the Advance-Decline Line?
The advance-decline line (ADL) is a technical indicator that plots the difference between the number of advancing stocks to declining stocks on a daily basis.

Understanding the Advance-Decline Line
The advance-decline line is used to show stock participation in a market risk or fall. Due to the number of capitalization-weighted indices (such as the S&P 500, the DJIA, and the NASDAQ Composite), stocks with a higher market capitalization would exert a disproportionate effect on the performance of an index. As such, the ADL provides an indication to investors regarding the participation of all stocks in an index in the direction of the market.
For example, if a capitalization-weighted stock index rose 3%, it would be important for investors to know whether (1) the rise in the index was due to a majority of stocks increasing, or (2) the rise in the index was driven by the strong performance of a company with a large weight on the index. The ADL can be used to provide such information.
Formula for the Advance-Decline Line
![]()
Where:
- Advancing Stocks refers to the number of stocks that increased in value on a daily basis;
- Declining Stocks refers to the number of stocks that decreased in value on a daily basis; and
- Previous Net Advances refers to the net amount of advancing and declining stocks on a daily basis.
To fully understand how the advance-decline line is calculated, an example is illustrated below.
Practical Example
An investor is looking to create an advance-decline line for an index over a period of five days. The investor is given the following information:
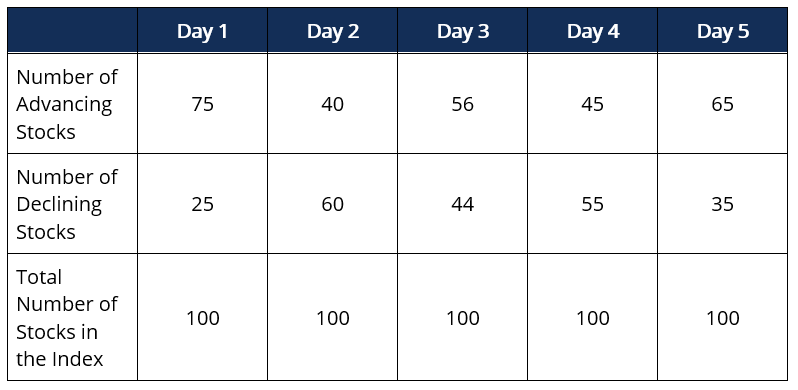
What is the ADL from Day 1 to Day 5?
ADL (Day 1) = 75 – 25 + 0 = 50
ADL (Day 2) = 40 – 60 + 50 = 30
ADL (Day 3) = 56 – 44 + 30 = 42
ADL (Day 4) = 45 – 55 + 42 = 32
ADL (Day 5) = 65 – 35 + 32 = 62
Interpreting the Advance-Decline Line
The advance-decline line is seldom used by itself. Instead, the ADL is plotted against its relevant index. Plotting the ADL against its relevant index can help investors confirm trends and the likelihood of reversals. Following, we illustrate four interpretations of the concept:
1. Advance-Decline Line and Index Trending Upwards
A situation where the advance-decline line and index are both trending upwards is said to be bullish. The rise in the index is driven by the rise in the majority of stocks in the index.
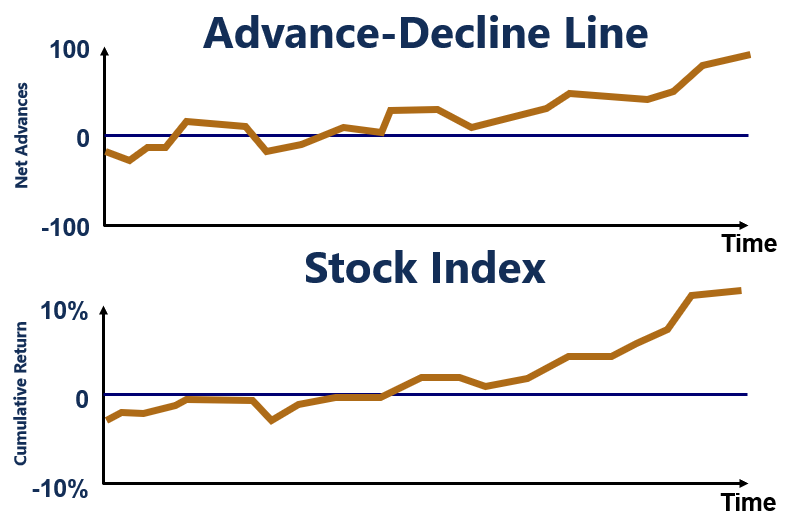
As such, investors tend to believe that the market will continue its uptrend in the near future.
2. Advance-Decline Line Trending Upwards and Index Trending Downwards
A situation where the advance-decline line and index are both trending downwards is said to be bearish. The decline in the index is driven by the decline in a majority of stocks in the index.
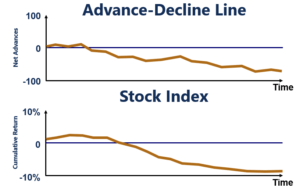
As such, investors tend to believe that the market will continue its downtrend in the near future.
3. Advance-Decline Line Trending Upwards and Index Trending Downwards
A situation where the advance-decline line is trending upwards, but the index is trending downwards is said to be a bullish divergence. The decline in the index is driven by the decline in a minority of stocks in the index. Therefore, it indicates that sellers are losing their conviction.
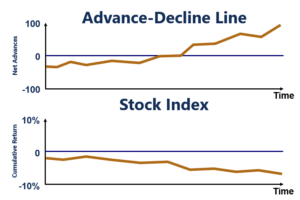
As such, investors tend to believe that the market will show a reversal and trend upwards in the near future.
4. Advance-Decline Line Trending Downwards and Index Trending Upwards
A situation where the advance-decline line is trending downwards, but the index is trending upwards is said to be a bearish divergence. The increase in the index is driven by the increase in a minority of stocks in the index. Therefore, it indicates that buyers are losing their conviction.
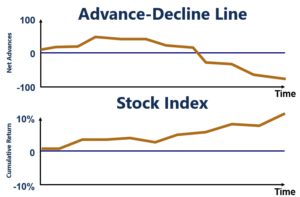
As such, investors tend to believe that the market will show a reversal and trend downwards in the near future.
More Resources
CFI offers the Capital Markets & Securities Analyst (CMSA®) certification program for those looking to take their careers to the next level. To keep learning and developing your knowledge base, please explore the additional relevant resources below:


