Net Volume
The difference between a security’s uptick volume and downtick volume
What is Net Volume?
Net volume is used to indicate the difference between a security’s uptick volume and downtick volume. Uptick volume is the volume of a company’s shares that are traded when the stock price is rising. Similarly, downtick volume is the volume of shares that are traded when the stock price is falling.
The difference or the net volume amount helps investors determine whether the market sentiment is bullish or bearish. If there is a positive net volume, then the market sentiment is positive or bullish, as more shares are being bought than sold. Negative net volume translates into negative or bearish market sentiment, as more shares are being sold relative to being bought.
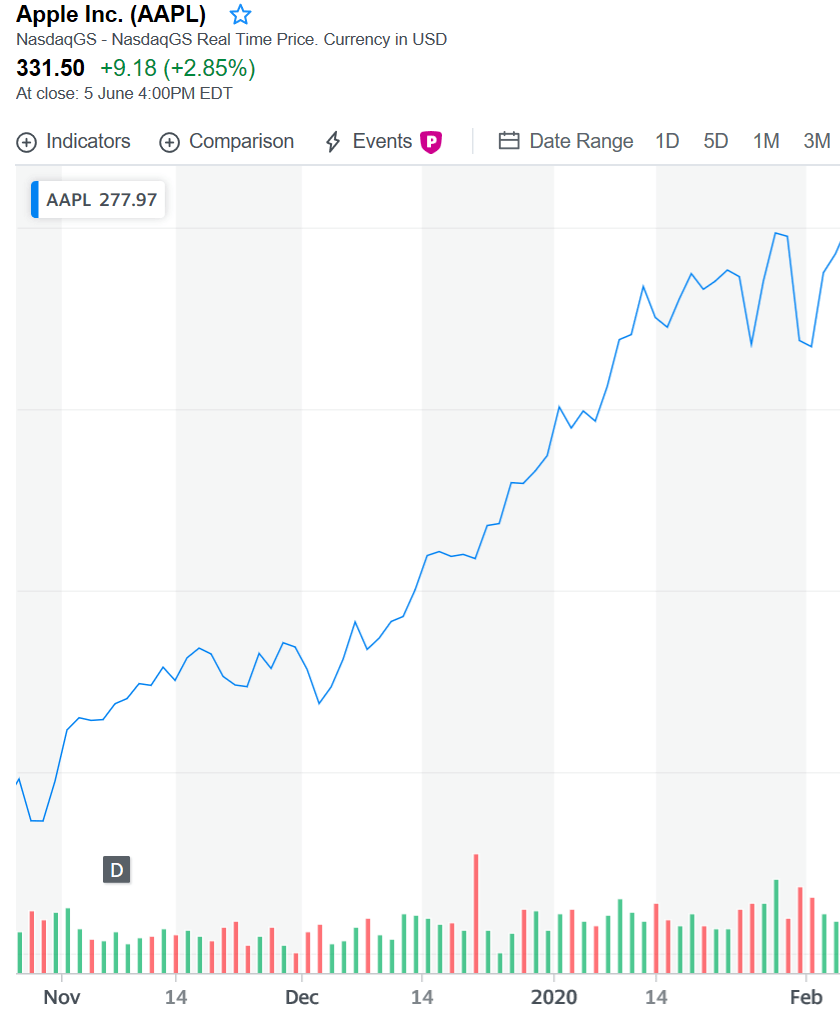
Net volume is typically plotted on a price chart against the time period (months or days) with the net volume represented as vertical bars. It is a useful tool that is employed by technical analysts to make decisions regarding potential stock trading opportunities. A typical net volume chart is shown above in Figure 1 (the green and red bars show positive and negative net volumes, respectively).
Summary
- Net volume is used to indicate the difference between a security’s uptick volume and downtick volume.
- It is typically plotted on a price chart against the time period (months or days) with the net volume represented as vertical bars.
- Resistance level is the price level of a stock beyond which investors are inclined to sell the stock. Support level is the price level at which investors would want to buy a stock.
- The volume-weighted average price (VWAP) is a trading benchmark that helps determine the average price of the security based on the volume traded and price.
Net Volume and Technical Analysis
Volume is the amount of a security that is traded on financial markets. It is a very commonly used indicator, and volume data is tracked and stored by almost all major exchanges and financial data providers. As the chart above shows, volume is plotted as red and green bars and is accompanied by a moving average line or the price trend line.
Volume is used to reflect momentum in stock prices. New events are a common example that can cause the trading volume to rise or fall. A positive news event can be perceived as a measure of strength, and it would be expected that there would be a high buying volume at the support level and high selling volume at the resistance level.
1. Resistance level
Resistance level is the price level of a stock beyond which investors are inclined to sell the stock. If the stock price rises above the resistance level, an average investor would prefer to close his position and realize a profit, rather than wait for the price to rise even more, as there is a risk that the price can fall and the profits get wiped out.
It can be thought of as a ceiling to the price at which an investor will wait to close his position. The resistance level is guided by market sentiment and investor trading behavior. It is used by technical analysts to determine when to buy or sell stocks.
2. Support level
Support level is the price level at which investors would want to buy a stock. It is essentially a floor beyond which investors believe the price would not fall further. Similar to the resistance level, the support level is used to gauge market sentiment and is employed by technical analysts to guide trading behavior.
Although stock prices typically fluctuate between the support and resistance levels – and trading volumes are indicative of that – it is possible that these levels are breached, and new support and resistance levels are formed over time.
3. Volume Weighted Average Price (VWAP)
In trading, price is a very important metric, but volume is also equally important when making informed decisions about buying/selling stocks. The volume-weighted average price (VWAP) is a trading benchmark that helps determine the average price of the security based on the trading volume and price.
The VWAP is calculated by finding the total dollar amount for each transaction and dividing the amount by the total number of shares traded on that day. The formula for VWAP is given below:
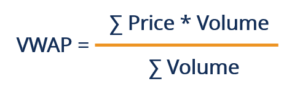
VWAP is an important trading trend tool that employs volume to determine whether to buy or sell stocks. If the stock price is higher than the VWAP, investors prefer to take long positions. If the stock price is lower than VWAP, short positions may be preferred. However, VWAP should not be used as an accurate predictive indicator, as it uses historical prices and may be misleading if stock prices move rapidly throughout the day.
Related Readings
CFI is the official provider of the global Commercial Banking & Credit Analyst (CBCA)™ certification program, designed to help anyone become a world-class financial analyst. To keep advancing your career, the additional resources below will be useful:


