Cool Excel Spreadsheets
Avoid poorly organized spreadsheets and make data processing, analysis, and presentation efficient
How to Create Cool Excel Spreadsheets
Excel is a powerful tool to process and present data, but poorly organized spreadsheets can easily become messy and make the data processing, analysis, and presentation less efficient. Here are some ways to create cool Excel spreadsheets.
Summary
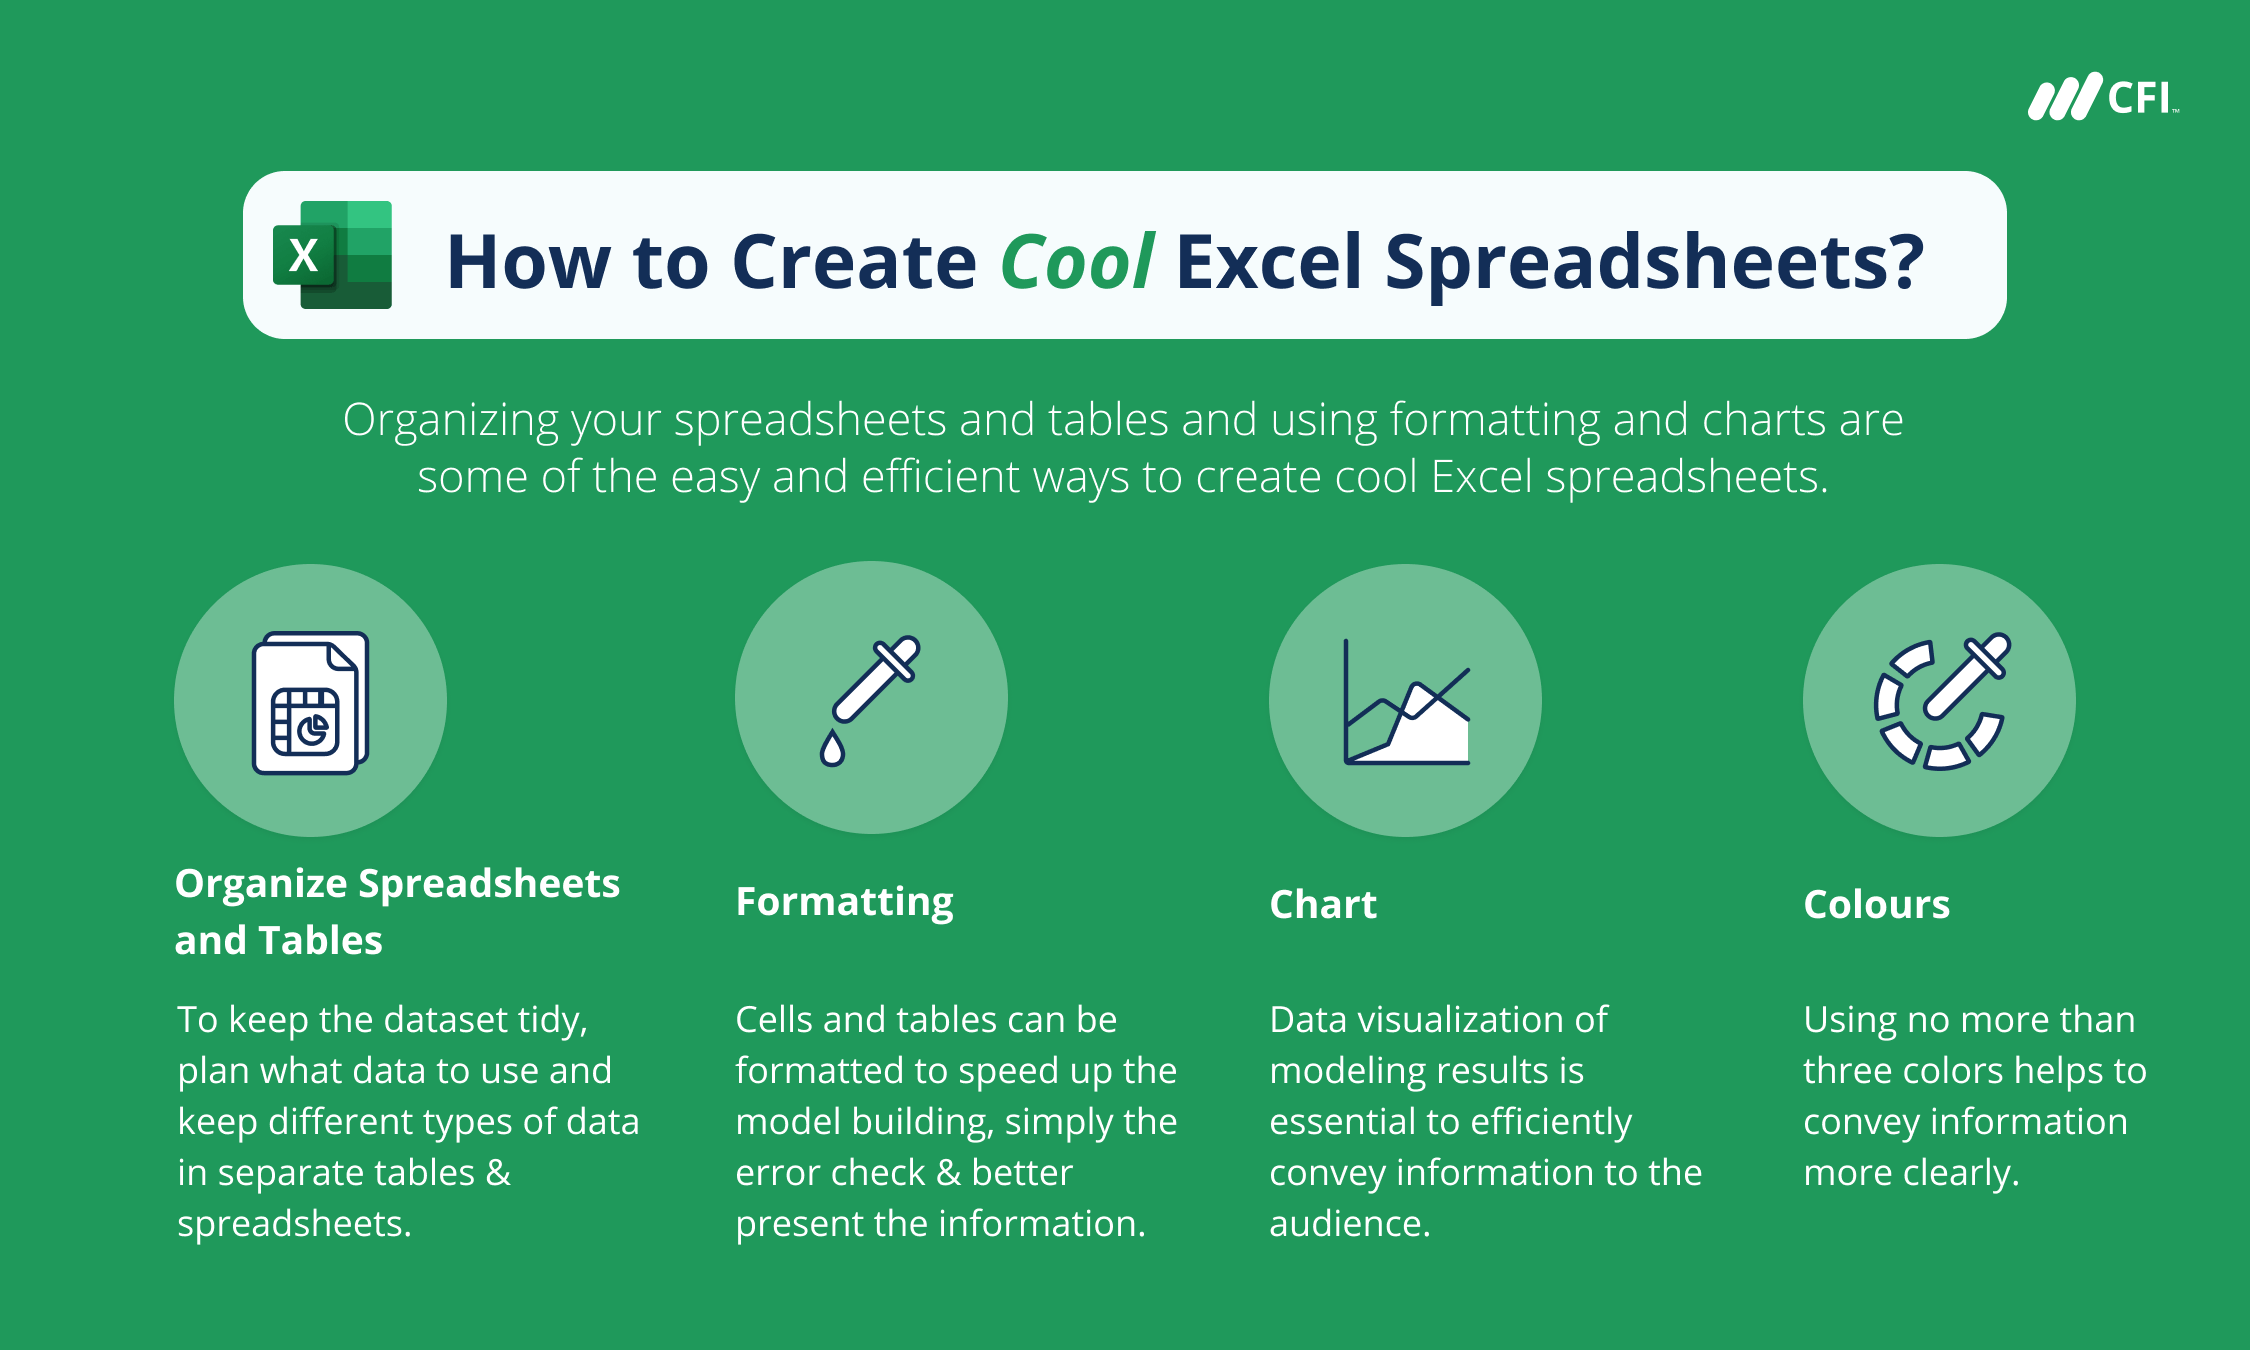
- Organizing your spreadsheets and tables and using formatting and charts are some of the easy and efficient ways to create cool Excel spreadsheets.
- Under the color conventions for financial modeling, blue is used for hard-coded numbers, black is for formulas referring to other cells, green is for references to other worksheets, and red is for references to external sources.
- While using charts to visualize the data results, using no more than three colors helps to convey information more clearly.
Download CFI’s Excel Keyboard Shortcuts Cheat Sheet
Click the button below to download our free Excel Keyboard Shortcuts Cheat Sheet!
Organize Spreadsheets and Tables
The first step is to organize your spreadsheets. You can start with planning what data to use and what the steps are to process the data. Keeping different types of data in separate tables and spreadsheets helps to keep the dataset tidy.
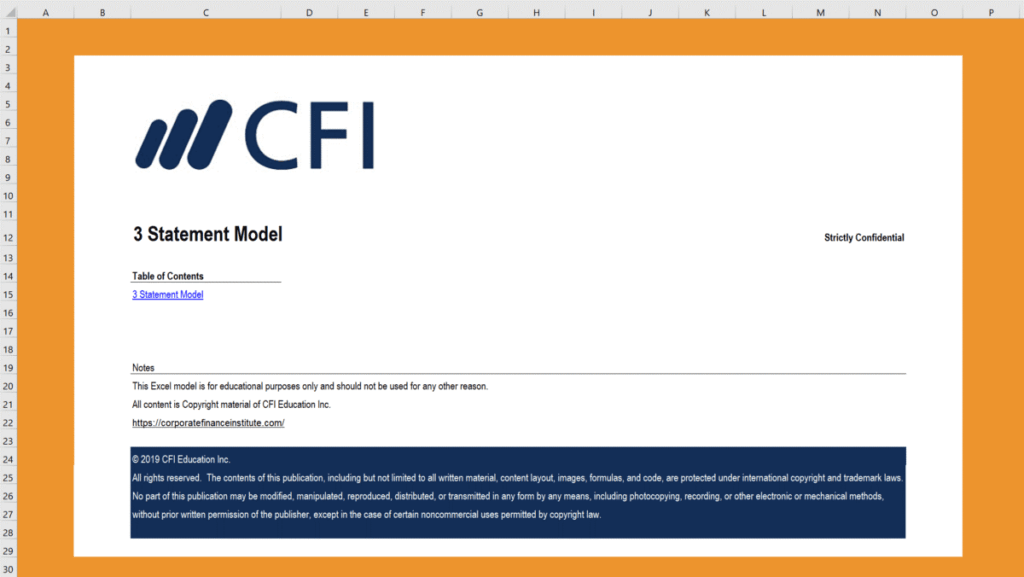
For example, in financial modeling, the data inputs – typically assumptions under different scenarios – are often kept in a separate worksheet from the rest of the modeling process. A cover page is usually added at the beginning of a workbook so that the audience can know what the Excel file is about and who prepared it at first glance.
Formatting
Cells and tables can be formatted to speed up the model building, simply the error check, and better present the information. In the example below, the historical part and forecasted part of the row of years are highlighted in different colors to easily distinguish the two periods.
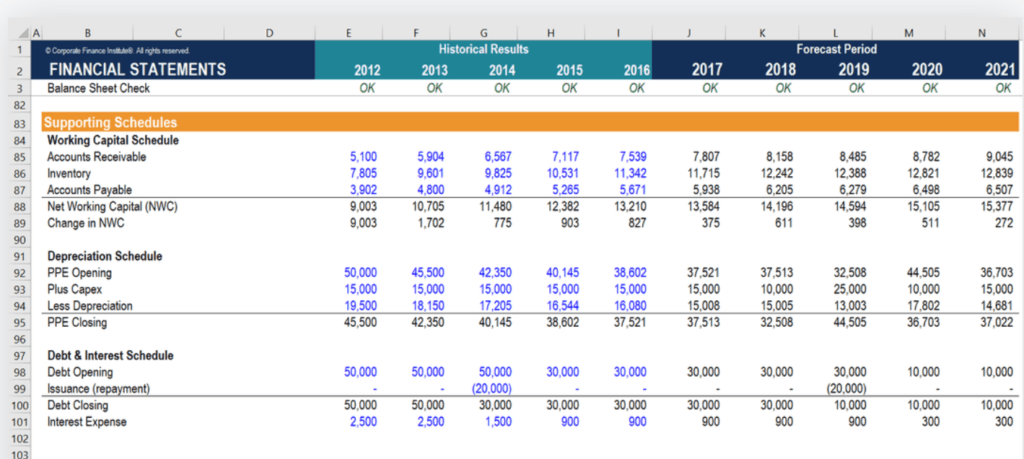
You may also notice that some of the cells under the historical period are marked in blue, while the others are in black. The historical data that are direct inputs extracted from a company’s existing financial reports and remain unchanged are marked in blue. Users are not expected to change these inputs as long as they are error-free.
The cells that contain formulas, such as “PPE Closing,” calculated based on the opening PPE, Capex, and depreciation, as well as the forecasted values calculated based on the historical data and assumptions, are kept in black. The numbers are subject to the changes in model assumptions. The other color codes also include green for cells that contain calculations referring to another worksheet and red for references to external sources.
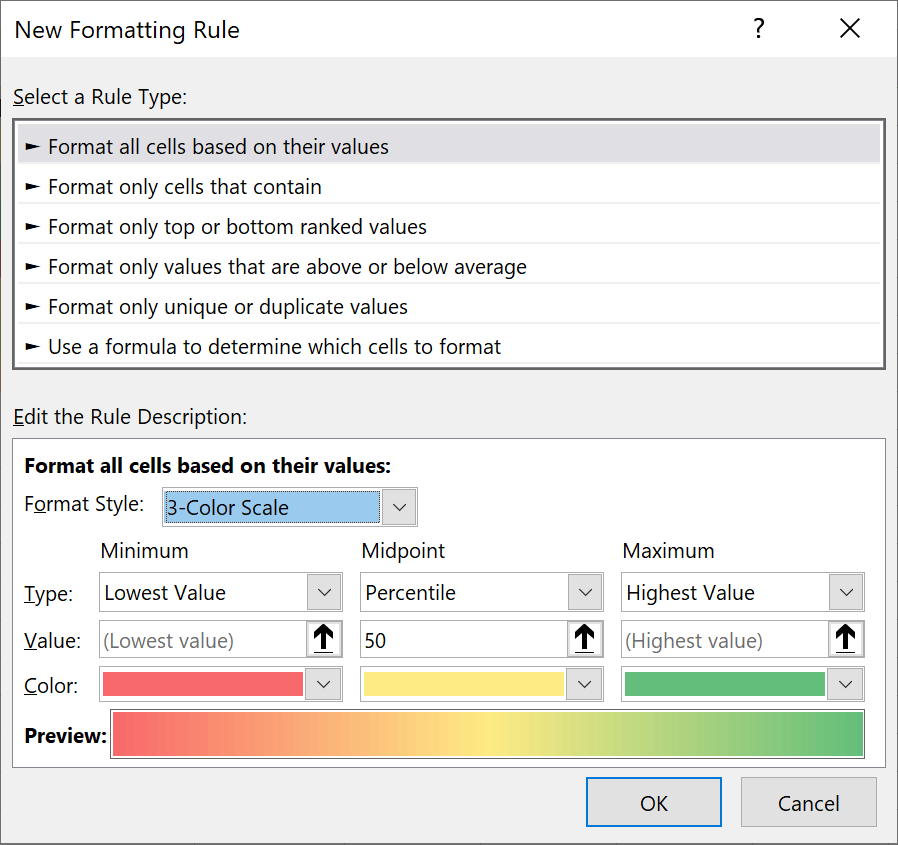
Excel also contains other useful formatting tools, such as conditional formatting. It applies color-based formatting to cells that meet certain criteria. For example, the “Color Scales” formatting is applied in the table below, where the higher scores under each factor are highlighted in green, and the lower scores are in red. The rules of formatting can be customized according to specific needs.

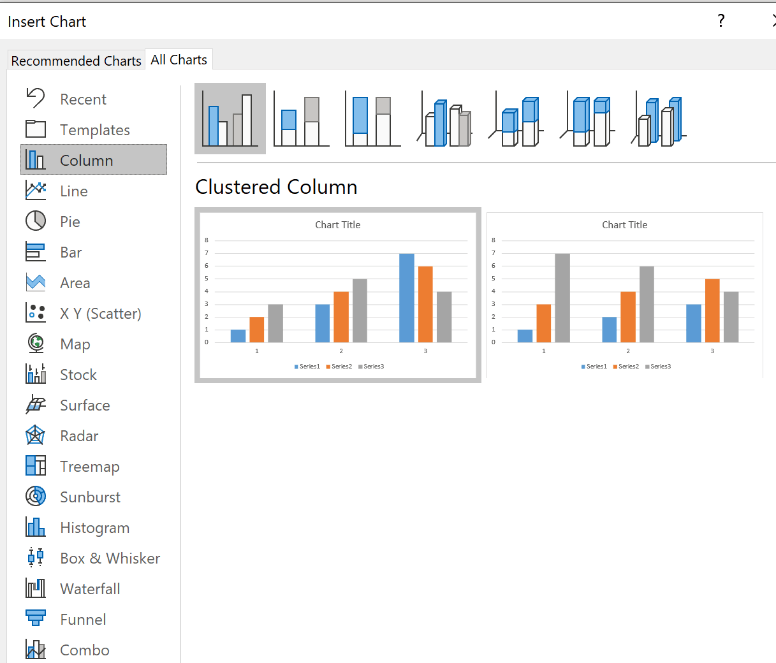
Charts
Data visualization of modeling results is essential to efficiently convey information to the audience. A variety of charts are provided under the “Insert” tab. You can choose the chart type that fits the best among them. For example, line and histogram charts are good to show trends or for overtime comparison, and they are often used to present the historical performance of a business.
Pie, treemap, and sunburst charts show proportions out of a total, which can be used for the customer base or segment breakdowns. Funnel charts are also known as tornado charts, and they are often used in sensitivity analysis.
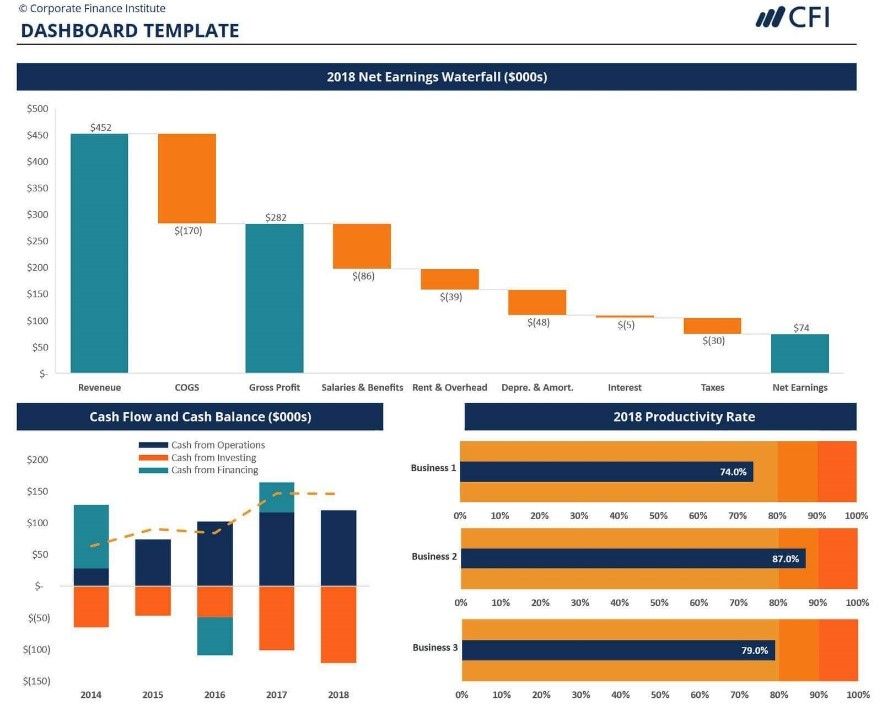
Below is an Excel dashboard example that CFI provides in its Excel Dashboards & Data Visualization course, which is both visually appealing and informative using only the three CFI primary colors. More data visualization skills are provided in the course to help you build cool Excel spreadsheets.
A caveat here is to limit the use of different colors. Colors help to visually distinguish categories and levels, but it is not always the case that the more colors used, the better the visualization is. Using too many colors could make the charts too busy and causes confusion. It is suggested to use two to three colors in each chart and keep the charts consistent with the same theme.
Connect what you just learned to a clear career path with CFI’s role‑based courses and certification programs.
Additional Resources
To keep advancing your career, the additional CFI resources below will be useful:
Excel Tutorial
To master the art of Excel, check out CFI’s Excel Crash Course, which teaches you how to become an Excel power user. Learn the most important formulas, functions, and shortcuts to become confident in your financial analysis.

Launch CFI’s Excel Crash Course now to take your career to the next level and move up the ladder!


