Get Certified for Financial Modeling (FMVA)®
Gain in-demand industry knowledge and hands-on practice that will help you stand out from the competition and become a world-class financial analyst.
Display a range of outputs in Excel given a range of different inputs
Data tables are used in Excel to display a range of outputs given a range of different inputs. They are commonly used in financial modeling and analysis to assess a range of different possibilities for a company, given uncertainty about what will happen in the future.
Below is a step-by-step guide on how to create an Excel data table. In the example, we will look at how much operating profit a company will generate based on different product prices and different sales volumes. We have built a simple model that assumes one variable cost (cost of goods sold) and one fixed cost (general and administrative expenses).
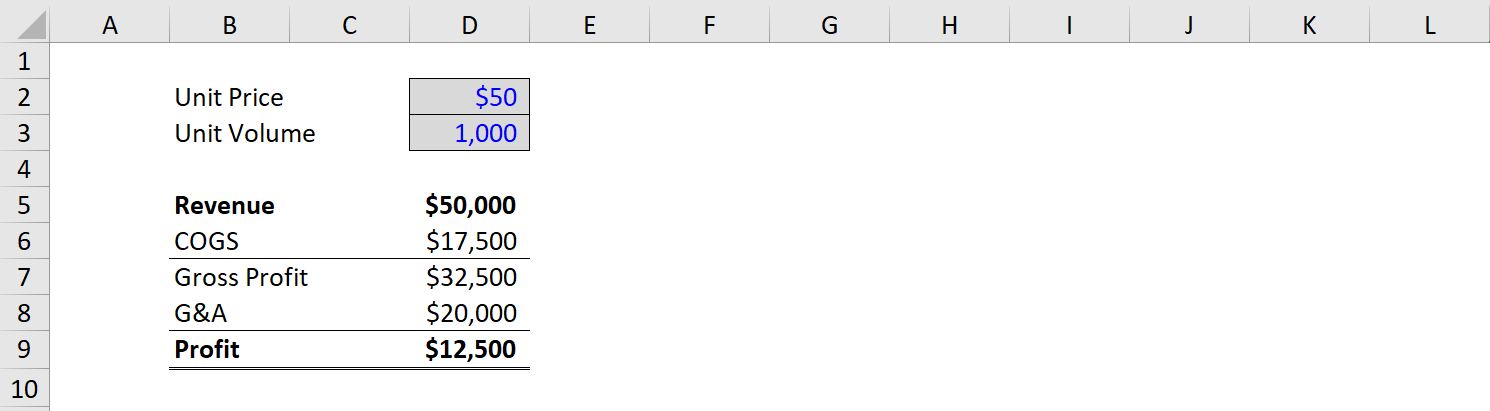
The first step when creating data tables is to have a model in place. We’ve made a simple model that includes two key assumptions: unit price and unit volume. From there, we have a simple income statement that includes revenue, COGS, G&A, and operating profit (EBIT).
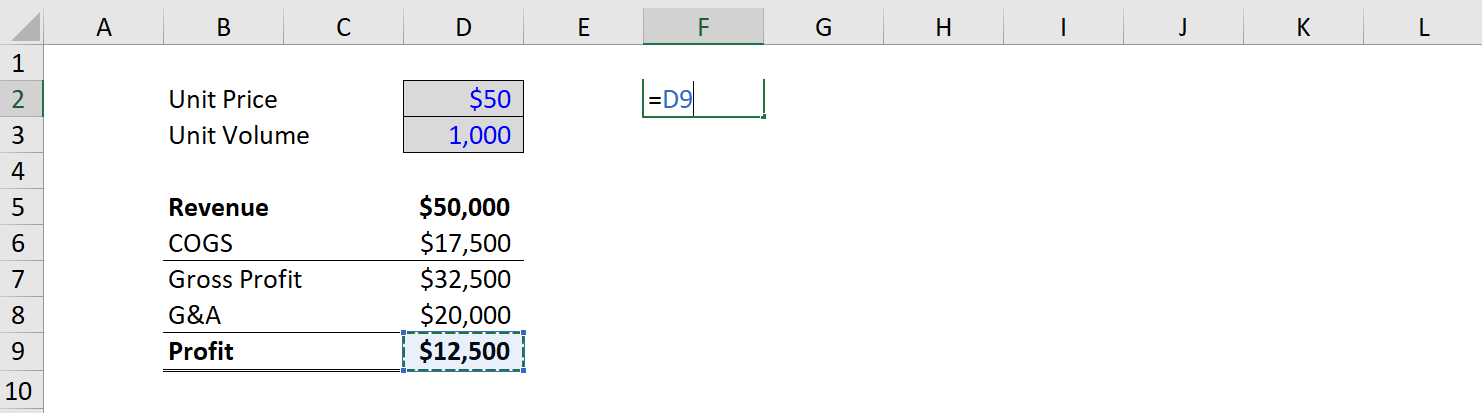
Since profit is what we want to use as the output, we simply take an empty cell in the model and link it to net income at the start of the data table (the top left corner).
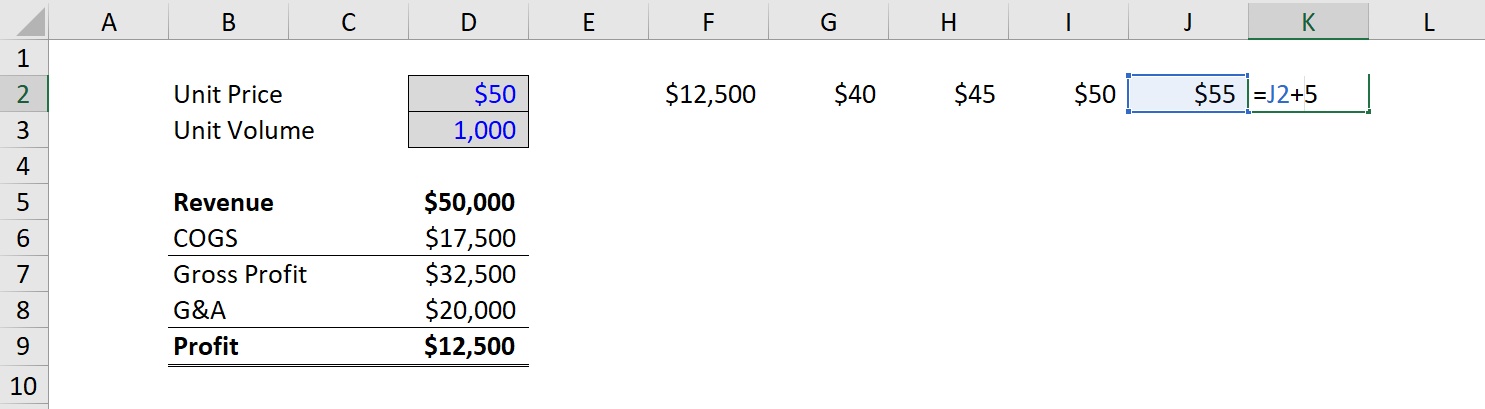
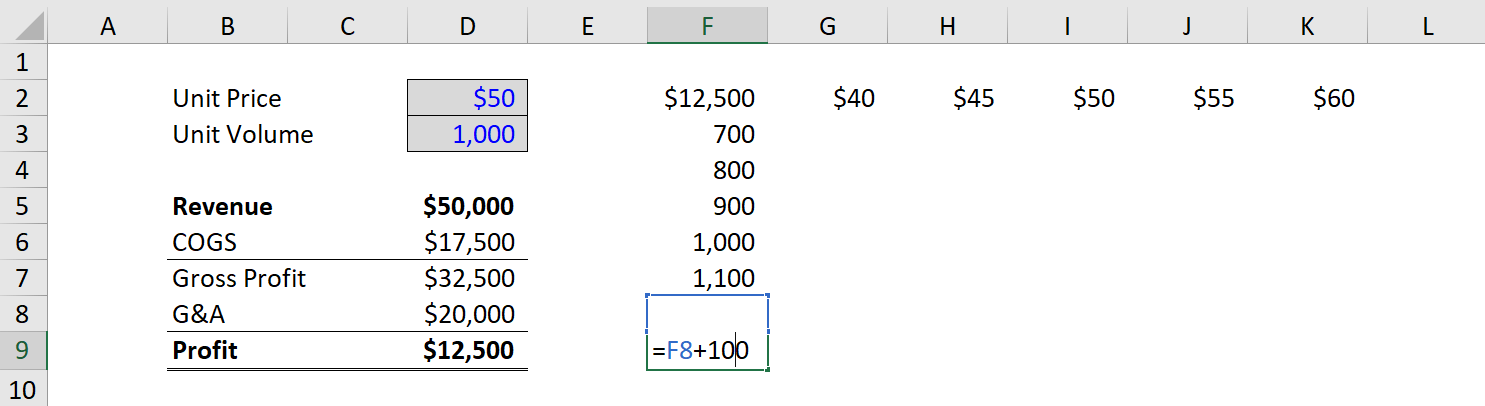
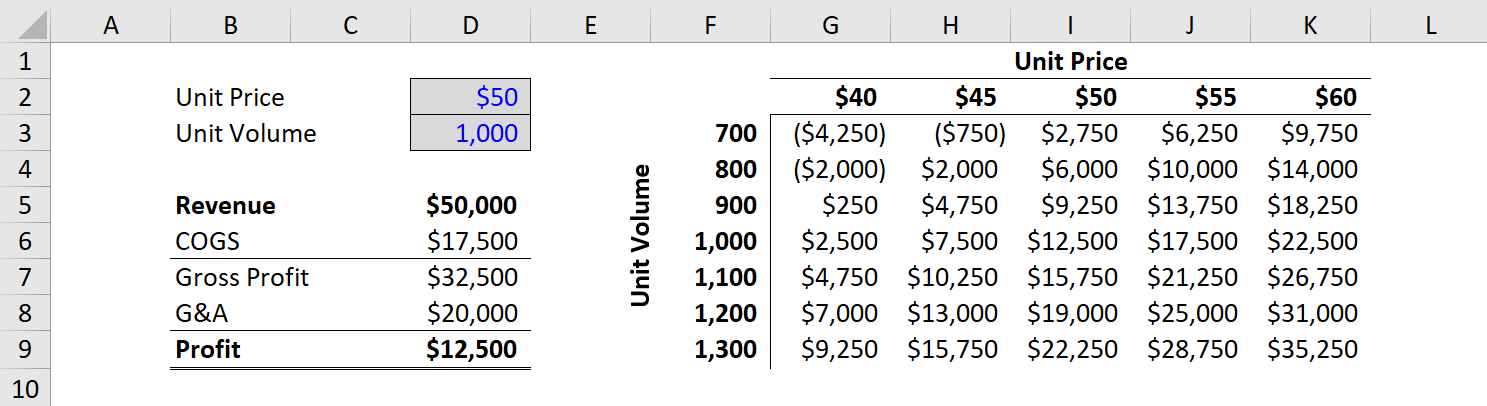
Once net income is linked, we need to enter the different values we want to test for unit prices and unit volumes. To do it, we manually enter the values across the top and left sides of the table. In this case, we will enter unit prices from $40 to $60 and volumes from 700 to 1,300.
To learn more about how to perform this type of analysis, check out CFI’s Sensitivity Analysis Course.
With the structure of the table complete, the next step is to highlight all the cells with data that will be used to form the table, and then access the Excel data tables function under the Data ribbon and What-If analysis.
The keyboard shortcut on Windows is Alt, A, W, T.
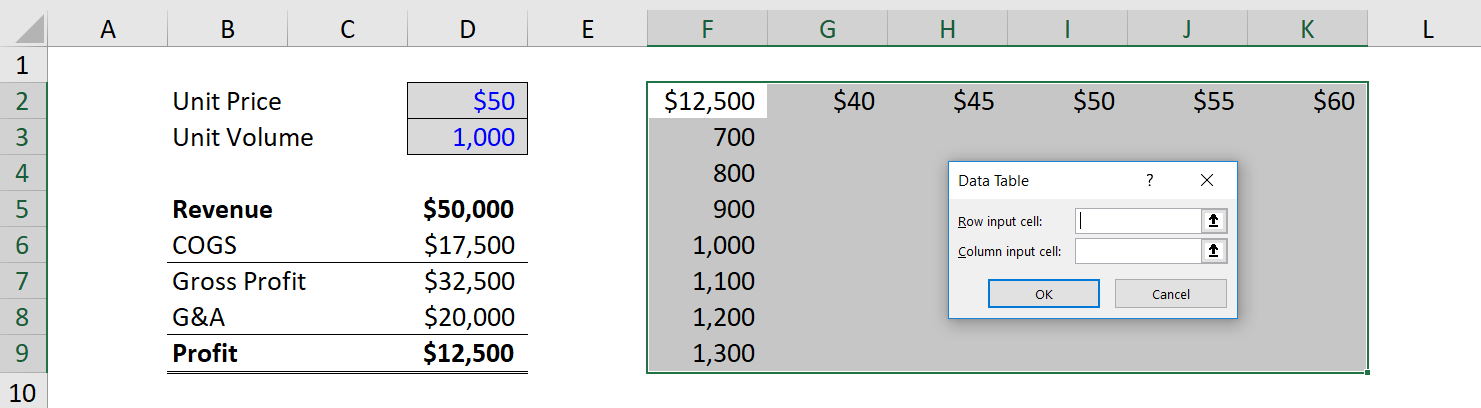
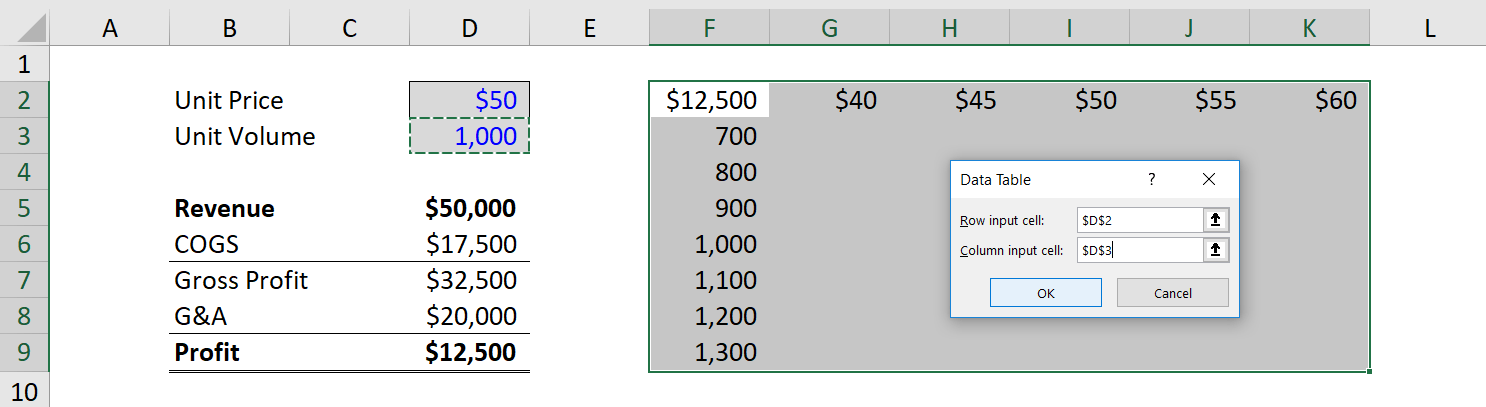
This can be one of the trickiest steps when setting up data tables. Financial analysts often aren’t sure where the Row Input Cell goes and where the Column Input Cell goes. The easiest way to think about it that the Row refers to the assumptions across the top of the table, and the Column refers to the assumptions across the left of the table. So, link each of them to the hard-coded assumptions that drive the model.
Once the table is linked, it can be helpful to do some basic formatting so that the data table is easier to read. This includes adding borders and labels, so users can easily see the information contained in the analysis.
You can download the Excel file for the example we worked through together in this guide. Use it to perform your own analysis!
Download the Free Data Table template here.
The main application of data tables is in performing sensitivity analysis for financial modeling and valuation. Since financial models represent a best-guess scenario on what the future holds for a business, it can be helpful to see how sensitive the value of the business is relative to various changes in assumptions.
To learn more about how to perform this type of analysis, check out CFI’s Sensitivity Analysis Course.
Connect what you just learned to a clear career path with CFI’s role‑based courses and certification programs.
Thank you for reading CFI’s guide to Data Tables, what they are, how to build them, and why they matter. To learn more and continue advancing your career, these additional CFI resources will be helpful:


