MIRR Guide
Modified Internal Rate of Return
What is MIRR?
The Modified Internal Rate of Return (MIRR)[1] is a function in Excel that takes into account the financing cost (cost of capital) and a reinvestment rate for cash flows from a project or company over the investment’s time horizon.
The standard Internal Rate of Return (IRR) assumes that all cash flows received from an investment are reinvested at the same rate. The Modified Internal Rate of Return (MIRR) allows you to set a different reinvestment rate for cash flows received. Additionally, MIRR arrives at a single solution for any series of cash flows, while IRR can have two solutions for a series of cash flows that alternate between negative and positive.
To learn more, launch our Advanced Excel Formulas course now!
What is the Modified Internal Rate of Return (MIRR) Formula in Excel?
The MIRR formula in Excel is as follows:
=MIRR(cash flows, financing rate, reinvestment rate)
Where:
- Cash Flows – Individual cash flows from each period in the series
- Financing Rate – Cost of borrowing or interest expense in the event of negative cash flows
- Reinvestment Rate – Compounding rate of return at which positive cash flow is reinvested
An Example of the Modified Internal Rate of Return
Below is an example that provides the most clear-cut example of how MIRR differs from standard IRR.
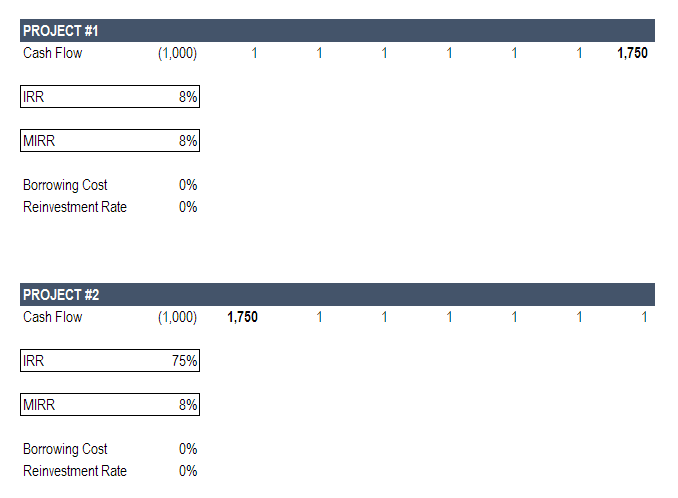
In the example below, we imagine two different projects. In both cases the total amount of cash received over the investment’s life is the same – the only difference is the timing of those cash flows.
Here are the key assumptions:
- Initial investment: $1,000 (same in both projects)
- Major positive cash flow: $1,750 (same in both cases)
- Timing of major cash flow: last year in Project 1; first year in Project 2
- Reinvestment rate for MIRR: 0%
To learn more, launch our Advanced Excel Formulas course now!
As you can see in the image above, there is a major difference in the return calculated by MIRR and IRR in Project #2. In project #1, there is no difference.
Let’s break down the reasons why.
MIRR Project #1
In Project #1, essentially all cash flow is received at the end of the project, so the reinvestment rate is irrelevant.
It’s important to show this case to clearly illustrate that reinvestment doesn’t matter when a project only has one final cash flow. Examples would be a zero-coupon bond or a Leveraged Buyout (LBO) where all cash flow is used to service debt until the company is sold for one large lump sum.
MIRR Project #2
In Project #2, by contrast, essentially all of the cash flow is received in year one. This means that the reinvestment rate is going to play a big role in the overall IRR of the project.
Since we set the reinvestment rate for MIRR to 0%, we can make an extreme example to illustrate the point.
The life of the investment is 7 years, so let’s look at what each result is saying.
MIRR is saying that, if you invested $1,000 at 8% for 7 years you would have $1,756 by the end of the project. If you sum up the cash flows in the example, you get $1,756, so this is correct.
So, why is the IRR result of 75% saying? Clearly, it’s not saying that if you invested $1,000 at 8% for 7 years you would have $50,524.
Recall that IRR is the discount rate that sets the Net Present Value (NPV) of an investment to zero. So, what the IRR case is saying is simply that discounting the $1,750 cash flow in year one needs to be discounted by 75% to arrive at an NPV of $0.
Which is Better, IRR or MIRR?
The answer is that it depends on what you’re trying to show and what the takeaway is. It can be helpful to look at both cases and play with different reinvestment rates in the MIRR scenario.
One thing that can be definitively said is that MIRR offers more control and is more precise.
To learn more, launch our Advanced Excel Formulas course now!
MIRR Application in Financial Modeling
When it comes to financial modeling, and specifically in private equity and investment banking, the standard IRR function is common practice. The reason for this is that transactions are looked at in isolation and not with the effect of then another investment assumption layered in.
MIRR requires an additional assumption, which could make two different transactions less comparable.
To master the art of building a financial model, launch our financial modeling courses now!
The Downside of Using Modified Internal Rate of Return
There are some downsides to using MIRR, the main one being the added complexity of making additional assumptions about what rate funds will be reinvested at. Additionally, it is not nearly as widely used as traditional IRR, so it will require more socializing, buy-in, and explaining at most corporations, banks, accounting firms, and institutions.
Additional Resources
We hope this has been a useful guide to the Modified Internal Rate of Return MIRR, how to use it in Excel, and what the pros and cons of it are.
For more learning and development, we highly recommend the following additional CFI resources:
Article Sources
Analyst Certification FMVA® Program
Below is a break down of subject weightings in the FMVA® financial analyst program. As you can see there is a heavy focus on financial modeling, finance, Excel, business valuation, budgeting/forecasting, PowerPoint presentations, accounting and business strategy.

A well rounded financial analyst possesses all of the above skills!
Additional Questions & Answers
CFI is the global institution behind the financial modeling and valuation analyst FMVA® Designation. CFI is on a mission to enable anyone to be a great financial analyst and have a great career path. In order to help you advance your career, CFI has compiled many resources to assist you along the path.
In order to become a great financial analyst, here are some more questions and answers for you to discover:
- What is Financial Modeling?
- How Do You Build a DCF Model?
- What is Sensitivity Analysis?
- How Do You Value a Business?
Excel Tutorial
To master the art of Excel, check out CFI’s Excel Crash Course, which teaches you how to become an Excel power user. Learn the most important formulas, functions, and shortcuts to become confident in your financial analysis.

Launch CFI’s Excel Crash Course now to take your career to the next level and move up the ladder!


