Get Certified for
Business Intelligence (BIDA®)
Develop analytical superpowers by learning how to use programming and data analytics tools such as VBA, Python, Tableau, Power BI, Power Query, and more.
A table that captures the correlation coefficients between different variables
A correlation matrix is simply a table that displays the correlation coefficients for different variables. The matrix depicts the correlation between all the possible pairs of values in a table. It is a powerful tool to summarize a large dataset and to identify and visualize patterns in the given data.
A correlation matrix consists of rows and columns that show the variables. Each cell in a table contains the correlation coefficient.
In addition, the correlation matrix is frequently utilized in conjunction with other types of statistical analysis. For instance, it may be helpful in the analysis of multiple linear regression models. Remember that the models contain several independent variables. In multiple linear regression, the correlation matrix determines the correlation coefficients between the independent variables in a model.
In order to understand the necessary steps in creating a correlation matrix in Excel, let’s consider the following example. You are the stock analyst in the investment bank. Your manager recently asked you to analyze the correlations between the prices of stocks that can be potentially added to the portfolio. You then analyze the stocks of the following companies: NVIDIA, Ford, Shell, and Alphabet.
The best way to analyze the correlations between the stock prices of the abovementioned companies is to create a correlation matrix. It can be done through the following steps:
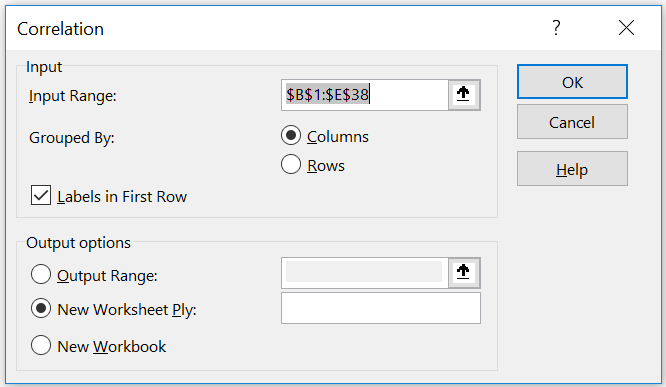
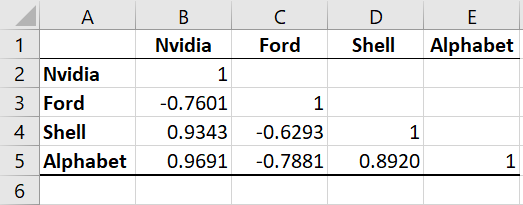
Your matrix should look like the image below:
Learn more in CFI’s Advanced Excel Formulas Course.
Thank you for reading CFI’s guide to Correlation Matrix. To keep learning and advancing your career, the following CFI resources will be helpful:
To master the art of Excel, check out CFI’s Excel Crash Course, which teaches you how to become an Excel power user. Learn the most important formulas, functions, and shortcuts to become confident in your financial analysis.

Launch CFI’s Excel Crash Course now to take your career to the next level and move up the ladder!


