Consolidation Model Template
Consolidation Model Template
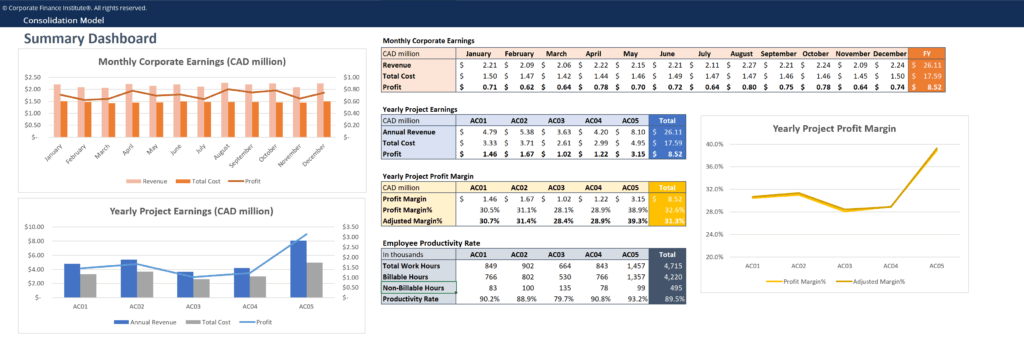
The following consolidation model template helps you summarize the financial performance of multiple business units into a consolidated model.
Below is a screenshot of the consolidation model template:
Download the Consolidation Model Template
Click the button below to download our free Consolidation Model Template!
How to Build a Construction Model
A Consolidation Model is constructed by combining the financial results of multiple business units into one single model. Typically, the first worksheet of the model is a summary or consolidation view that shows the highest-level figures (monthly and yearly revenues, profits, costs, productivity rate, etc.) in the form of tables, graphs, or charts. Other tabs in the model display financial data by departments, business units, or product lines by years, quarters, or months.
For our sample model, projects are the main “business units” with their own revenues and costs. This is a very simple model with only a few inputs, but in a real-world business setting, consolidation models can be quite complicated, involving multiple data sources and in-depth calculations.
Connect what you just learned to a clear career path with CFI’s role‑based courses and certification programs.
More Free Templates
For more resources, check out our business templates library to download numerous free Excel modeling, PowerPoint presentation, and Word document templates.
Excel Tutorial
To master the art of Excel, check out CFI’s Excel Crash Course, which teaches you how to become an Excel power user. Learn the most important formulas, functions, and shortcuts to become confident in your financial analysis.

Launch CFI’s Excel Crash Course now to take your career to the next level and move up the ladder!


