Get Certified for Financial Modeling (FMVA)®
Gain in-demand industry knowledge and hands-on practice that will help you stand out from the competition and become a world-class financial analyst.
Using Cap Rates and Net Operating Income in Real Estate Financial Analysis
This is an excerpt from CFI’s Real Estate Financial Modeling Course.
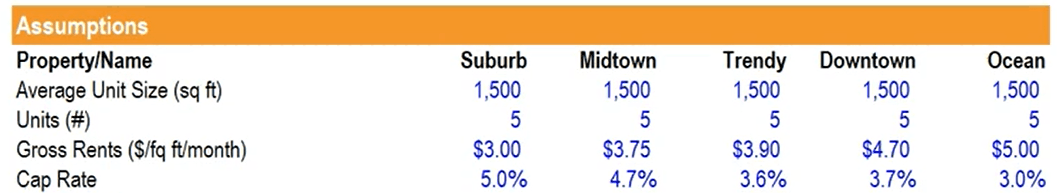
We will begin our real estate financial analysis by calculating the net operating income (NOI). Below are some assumptions for the real estate model:
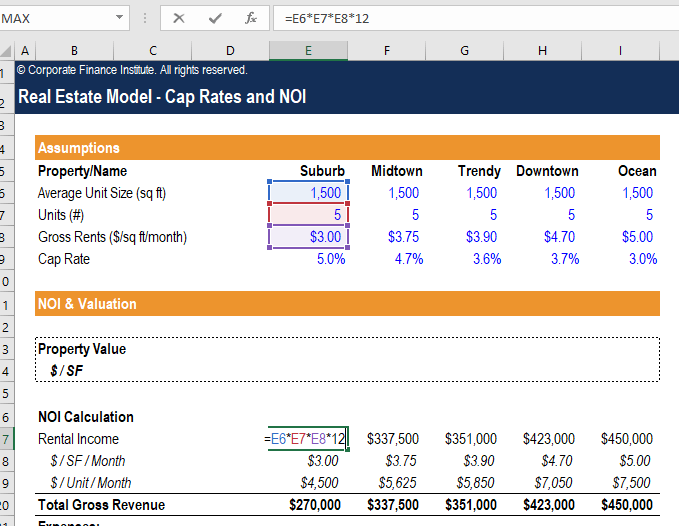
1. First, we will calculate the gross revenue.
Gross Revenue = Average Unit Size (sq ft) * Units (#) * Gross Rents ($sq/ft/month) * 12
Ex. Gross Revenue (Suburb) = 1,500*5*$3.00*12 = $270,000
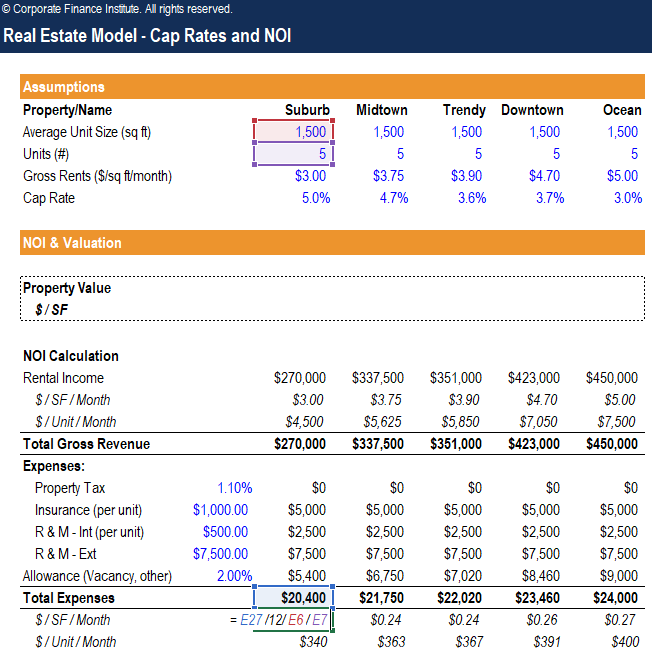
2. The next step in our real estate financial analysis is to find out the expenses, based on our assumptions here.
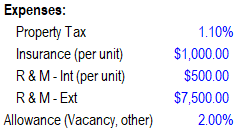
Property Tax = Property Value* 1.10% (The value will be $0 for now, but we’ll get a number once we calculate the property value)
Insurance = $1,000.00* Units (#)
R&M – Int = $500.00* Units (#)
R&M – Ext = $7,500.00
Allowance = 2.00%* Gross Revenue
Total Expense = SUM(Property Tax, Insurance, R&M – Int, R&M – Ext, Allowance)
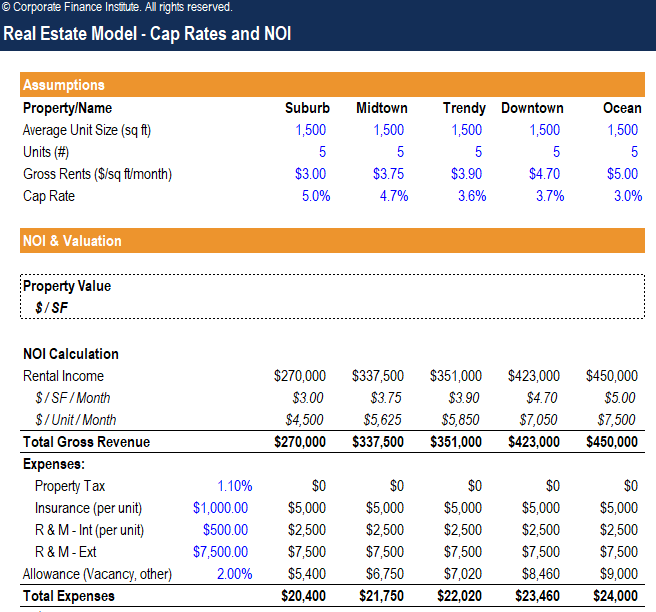
Here are the calculated expenses:
3. Next, we can calculate the expenses per square foot per month and expenses per unit per month.
$/SF/Month = Total Expenses / 12 / Average Unit Size (sq ft) / Units (#)
$/Unit/Month = Total Expenses / 12 / Units (#)
This is an excerpt from CFI’s Real Estate Financial Modeling Course.
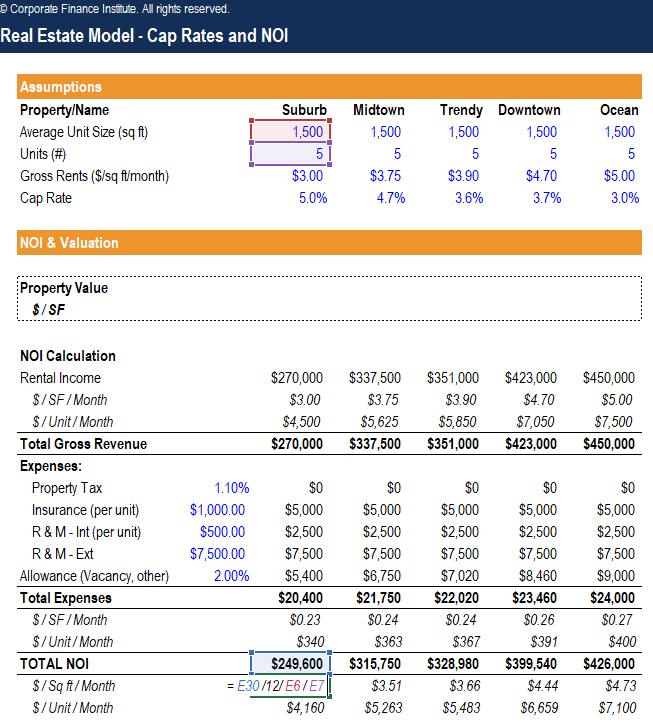
4. Finally, we will calculate the NOI.
NOI = Gross Revenue – Total Expenses
NOI/Sq ft/Month = NOI / 12 / Average Unit Size (sq ft) / Units (#)
NOI/Unit/Month = NOI / 12 / Units (#)
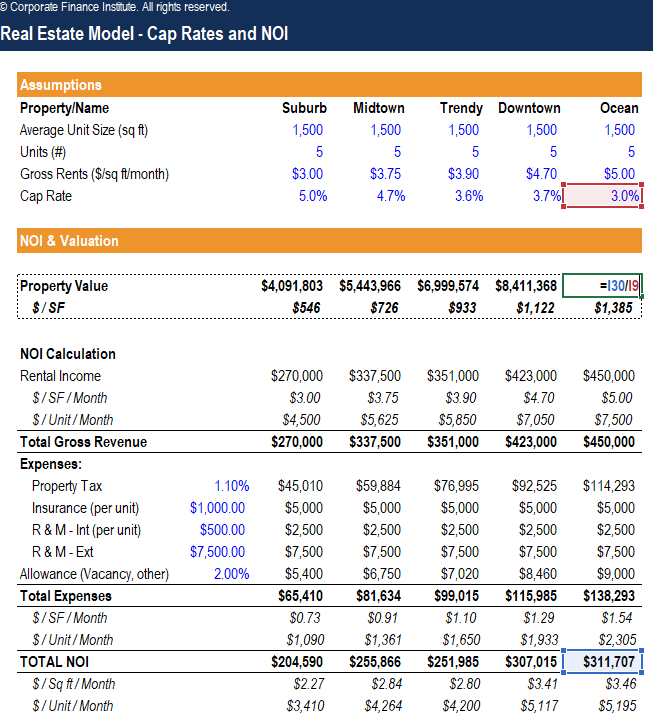
5. The last step will be calculating the property value, so we can calculate the property tax expenses.
Property Value = NOI / Cap Rate
Property Value/SF = Property Value / Average Unit Size (sq ft) / Units (#)
This is an excerpt from CFI’s Real Estate Financial Modeling Course.
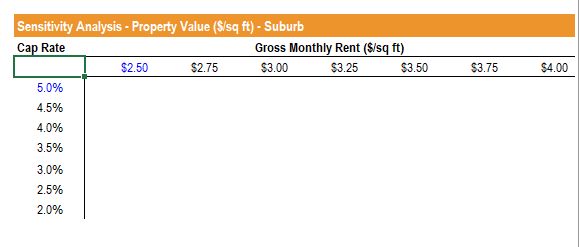
Now, we will perform a sensitivity analysis on the suburb property values, based on the gross monthly rent ($/sq ft) and cap rate.
6. First, we need to link the suburb property value/sq ft to the top-left cell of our sensitivity analysis table.
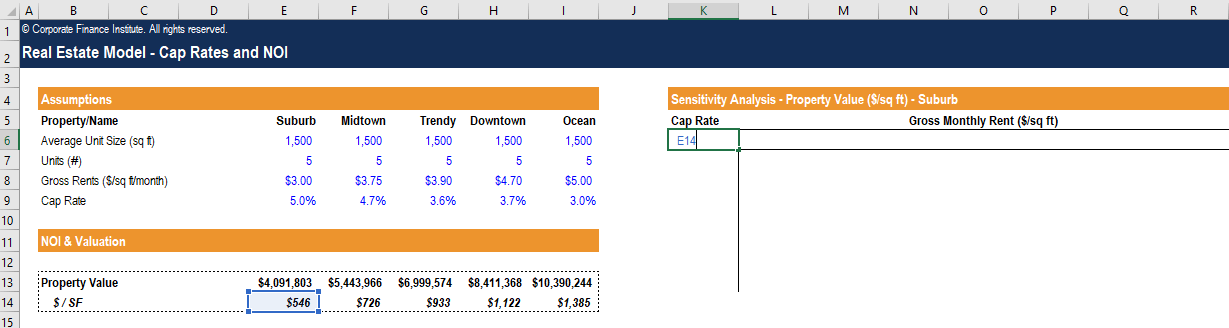
7. Then, we need to input a range of values for the per sq ft suburb monthly rents and the cap rates.
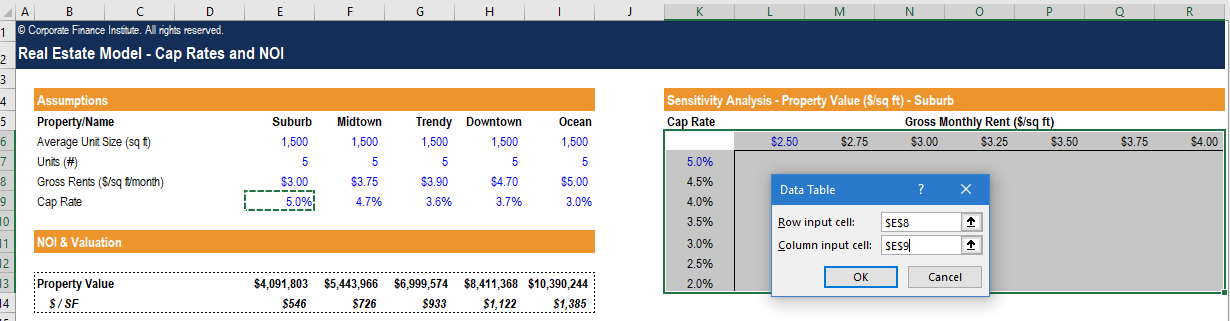
8. Now, we will show the suburb property value/SF in the middle of the table using the Data Table function. Select the entire sensitivity table, press ALT + A + W + T to open up the Data Table window. For row input cell, select the Suburb Gross Rents ($/sq ft/month) which is $3.00. For the column input cell, select the Cap Rate for Suburb which is 5.0%. Press OK.
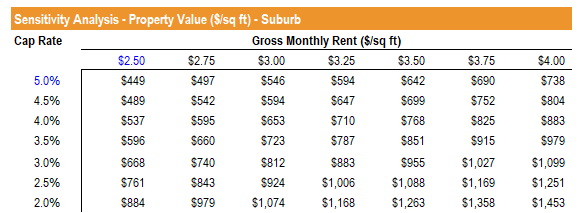
9. The sensitivity table is now filled in, showing the range of values based on different rental rates and cap rates for this property.
This is an excerpt from CFI’s Real Estate Financial Modeling Course.
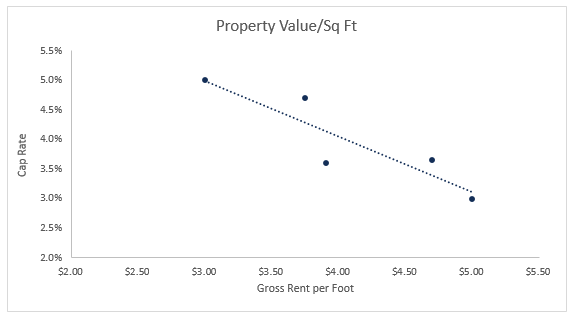
10. We now will build a chart that graphs the relationship between the gross rental income and the cap rate. Go to Insert and select a Scatter Plot. Right-click on the chart and choose “Select Data.” Add a new series, type “Property Value/Sq Ft” for series name. Select all Gross Rents for X values and Cap Rate for Y values. Click OK.

11. You can fit a trendline to show the linear relationship between cap rate and gross rent.
Connect what you just learned to a clear career path with CFI’s role‑based courses and certification programs.
CFI is the official provider of the global Financial Modeling & Valuation Analyst (FMVA)™ certification program, designed to help anyone become a world-class financial analyst. To keep advancing your career, the additional CFI resources below will be useful:


