Get Certified for Financial Modeling (FMVA)®
Gain in-demand industry knowledge and hands-on practice that will help you stand out from the competition and become a world-class financial analyst.
A leverage ratio that measures a company’s ability to pay off its debt
Net debt-to-EBITDA is a leverage ratio that compares a company’s liabilities in the form of net debt to its “cash flow,” in the form of EBITDA (stands for earnings before interest, taxes, depreciation and amortization).
Credit rating agencies and creditors rely on cash flows to measure the financial health and compare companies. Matching a company’s debt to its cash flow is critical when investors and creditors seek to weigh the likelihood of a company defaulting (i.e., unable to repay ongoing obligations as agreed).
While this is similar to the typical debt-to-EBITDA ratio in that both measure how much EBITDA (a loose proxy for operating cash flow) is available to support short-term debt and long-term liabilities, the net debt ratio refers to total debt minus liquid assets, e.g., cash and cash equivalents.
The use of net debt accounts for a legal and enforceable right typically held by senior lenders — the right of set-off. Often, liquid assets owned by a company can be legally used to repay revolving credit and other senior lender obligations in advance of payment to other creditors.
The net debt-to-EBITDA ratio formula is as follows:
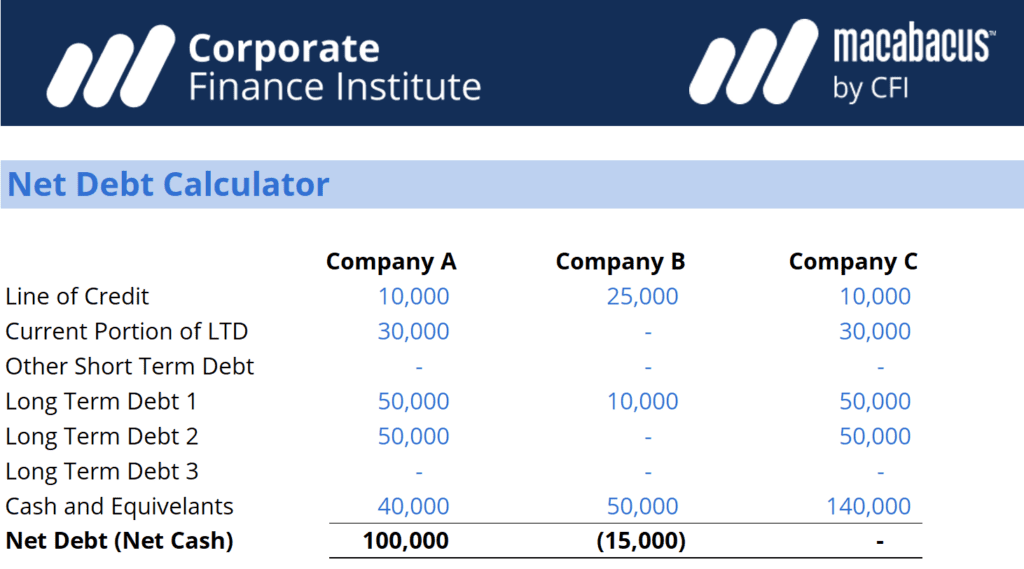
Net Debt:
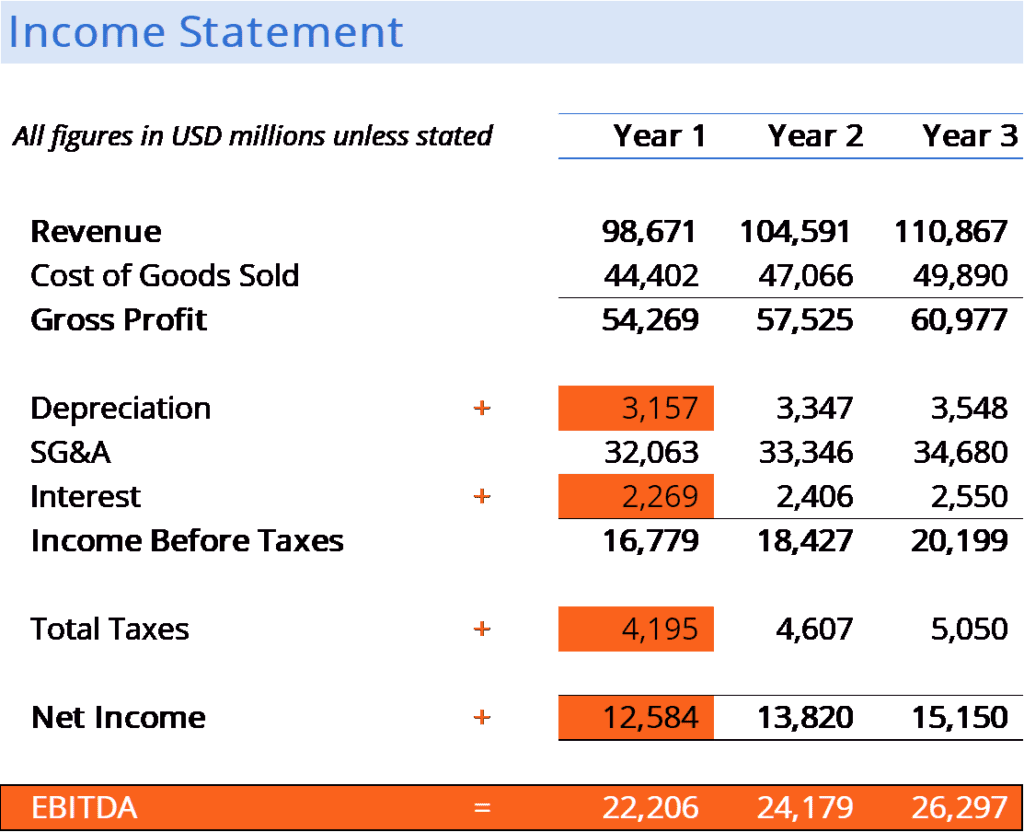
EBITDA:
A low net debt to EBITDA ratio is generally preferred by analysts, as it indicates that a company is not excessively indebted and should be able to repay its debt obligations compared to others in the same industry.
On the other hand, if the net debt to EBITDA ratio is higher than the industry average, a company may have a high net debt, or its EBITDA is too low to support debt repayment.
Credit rating agencies, potential investors, and corporate acquirers (i.e., for a merger or a takeover) often use the net debt-to-EBITDA ratio to value the company’s financial stability. One outcome of the assessment is the determination of the yield the company must pay on its obligations.
It is important to note that the net debt-to-EBITDA ratio is only a single indicator of a company’s financial situation and profitability. Scenarios such as the presence of other liabilities (e.g., off-balance sheet liabilities), as well as adding back interest relating to right-of-use assets to earnings when determining debt to EBITDA, can meaningfully impact EBITDA-ratio measures.
For example, if the company recently invested in property, plant, and equipment (PP&E) via the use of debt, the debt burden for the year is likely to be higher than in other years. Conversely, a company selling significant assets to repay debt may see a future EBITDA reduction.
Finally, changes in income and cash flow (the denominator) may reflect normal volatility rather than reflecting a structural change in the dynamics of the business.
Changes in assets (and debt) affect sales and cash flows in a future fiscal year, thus the net debt-to-EBITDA ratio for the current fiscal year will be impacted by any changes in short-term debt.
In summary, the ratio is not necessarily an accurate indicator of financial stability at a point in time, especially when net debt or cash flow volatility for a specified period is high and a longer period trend is directionally more useful.
According to PitchBook’s Leveraged Commentary Data, the debt/EBITDA ratio of leveraged buyout (LBO) loans has fallen below 5 as of Q1 2023, the lowest in seven years, inclusive of all debt (i.e., first-lien, second-lien, others). Although this is not net debt, the ratio suggests reduced M&A activities that are typically associated with business loans with higher leverage.
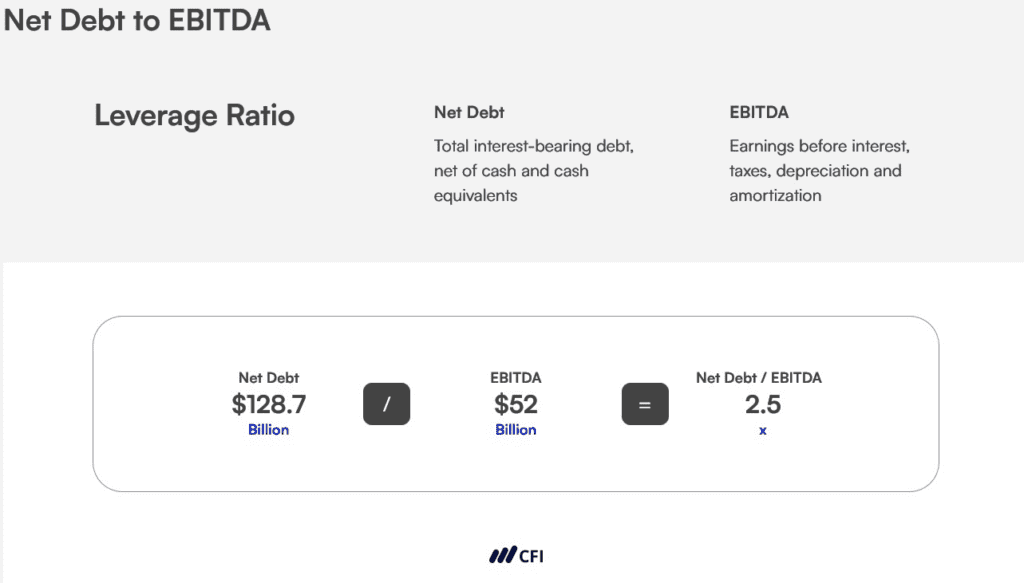
AT&T released its net debt to EBITDA ratio expectations using the following definitions and formula for its net debt-to-EBITDA ratio:
AT&T’s press release then says it “expects to achieve net debt-to-adjusted EBITDA in the 2.5x range in the first half of 2025.”
If we assume net debt is constant, then that implies EBITDA of $52 billion, as shown below:
| Net Debt | $128.7 |
| Expected Net Debt to EBITDA Ratio | 2.5x |
| EBITDA | $52 billion ($128.7 / 2.5x) |
AT&T’s debt / EBITDA ratio is associated with stable credit ratings by three rating agencies:
| Rating Agency | Long-Term Issuer Rating |
|---|---|
| Moody’s | Baa2 |
| S&P | BBB |
| Fitch | BBB+ |
With AT&T’s loan agreement, the financial covenant of 3.5x is defined as the following:
Connect what you just learned to a clear career path with CFI’s role‑based courses and certification programs.
Thank you for reading CFI’s explanation of the Net Debt to EBITDA Ratio. CFI offers the Financial Modeling & Valuation Analyst (FMVA)™ certification program and other training for financial professionals.
To learn more and expand your career, explore the additional relevant CFI resources below.


