Ratio Analysis

Comparisons between the financial information in the financial statements of a business

Over 1.8 million professionals use CFI to learn accounting, financial analysis, modeling and more. Start with a free account to explore 20+ always-free courses and hundreds of finance templates and cheat sheets.

What is Ratio Analysis?

Ratio analysis refers to the analysis of various pieces of financial information in the financial statements of a business. They are mainly used by external analysts to determine various aspects of a business, such as its profitability, liquidity, and solvency.

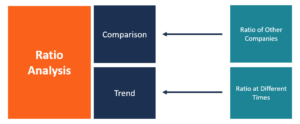
Ratio Analysis Diagram

Analysts rely on current and past financial statements to obtain data to evaluate the financial performance of a company. They use the data to determine if a company’s financial health is on an upward or downward trend and to draw comparisons to other competing firms.

Uses of Ratio Analysis

1. Comparisons

One of the uses of ratio analysis is to compare a company’s financial performance to similar firms in the industry to understand the company’s position in the market. Obtaining financial ratios, such as Price/Earnings, from known competitors and comparing it to the company’s ratios can help management identify market gaps and examine its competitive advantages, strengths, and weaknesses. The management can then use the information to formulate decisions that aim to improve the company’s position in the market.

2. Trend line

Companies can also use ratios to see if there is a trend in financial performance. Established companies collect data from the financial statements over a large number of reporting periods. The trend obtained can be used to predict the direction of future financial performance, and also identify any expected financial turbulence that would not be possible to predict using ratios for a single reporting period.

3. Operational efficiency

The management of a company can also use financial ratio analysis to determine the degree of efficiency in the management of assets and liabilities. Inefficient use of assets such as motor vehicles, land, and building results in unnecessary expenses that ought to be eliminated. Financial ratios can also help to determine if the financial resources are over- or under-utilized.

Ratio Analysis – Categories of Financial Ratios

There are numerous financial ratios that are used for ratio analysis, and they are grouped into the following categories:

1. Liquidity ratios

Liquidity ratios measure a company’s ability to meet its debt obligations using its current assets. When a company is experiencing financial difficulties and is unable to pay its debts, it can convert its assets into cash and use the money to settle any pending debts with more ease.

Some common liquidity ratios include the quick ratio, the cash ratio, and the current ratio. Liquidity ratios are used by banks, creditors, and suppliers to determine if a client has the ability to honor their financial obligations as they come due.

2. Solvency ratios

Solvency ratios measure a company’s long-term financial viability. These ratios compare the debt levels of a company to its assets, equity, or annual earnings.

Important solvency ratios include the debt to capital ratio, debt ratio, interest coverage ratio, and equity multiplier. Solvency ratios are mainly used by governments, banks, employees, and institutional investors.

3. Profitability Ratios

Profitability ratios measure a business’ ability to earn profits, relative to their associated expenses. Recording a higher profitability ratio than in the previous financial reporting period shows that the business is improving financially. A profitability ratio can also be compared to a similar firm’s ratio to determine how profitable the business is relative to its competitors.

Some examples of important profitability ratios include the return on equity ratio, return on assets, profit margin, gross margin, and return on capital employed.

4. Efficiency ratios

Efficiency ratios measure how well the business is using its assets and liabilities to generate sales and earn profits. They calculate the use of inventory, machinery utilization, turnover of liabilities, as well as the usage of equity. These ratios are important because, when there is an improvement in the efficiency ratios, the business stands to generate more revenues and profits.

Some of the important efficiency ratios include the asset turnover ratio, inventory turnover, payables turnover, working capital turnover, fixed asset turnover,  and receivables turnover ratio.

5. Coverage ratios

Coverage ratios measure a business’ ability to service its debts and other obligations. Analysts can use the coverage ratios across several reporting periods to draw a trend that predicts the company’s financial position in the future. A higher coverage ratio means that a business can service its debts and associated obligations with greater ease.

Key coverage ratios include the debt coverage ratio, interest coverage, fixed charge coverage, and EBIDTA coverage.

6. Market prospect ratios

Market prospect ratios help investors to predict how much they will earn from specific investments. The earnings can be in the form of higher stock value or future dividends. Investors can use current earnings and dividends to help determine the probable future stock price and the dividends they may expect to earn.

Key market prospect ratios include dividend yield, earnings per share, the price-to-earnings ratio, and the dividend payout ratio.

Related Readings

Thank you for reading CFI’s guide to Ratio Analysis. To keep learning and advancing your career, the following CFI resources will be helpful:

Free Accounting Courses

Learn accounting fundamentals and how to read financial statements with CFI’s free online accounting classes.
These courses will give the confidence you need to perform world-class financial analyst work. Start now!


Building confidence in your accounting skills is easy with CFI courses! Enroll now for FREE to start advancing your career!

0 search results for ‘