Get Certified for Financial Modeling (FMVA)®
Gain in-demand industry knowledge and hands-on practice that will help you stand out from the competition and become a world-class financial analyst.
The point in which total cost and total revenue are equal
Break-even analysis in economics, business, and cost accounting refers to the point at which total costs and total revenue are equal. A break-even point analysis is used to determine the number of units or dollars of revenue needed to cover total costs (fixed and variable costs).
The formula for break-even analysis is as follows:
Break-Even Quantity = Fixed Costs / (Sales Price per Unit – Variable Cost Per Unit)
where:
It is also helpful to note that the sales price per unit minus variable cost per unit is the contribution margin per unit. For example, if a book’s selling price is $100 and its variable costs are $5 to make the book, $95 is the contribution margin per unit and contributes to offsetting the fixed costs.
Colin is the managerial accountant in charge of Company A, which sells water bottles. He previously determined that the fixed costs of Company A consist of property taxes, a lease, and executive salaries, which add up to $100,000. The variable cost associated with producing one water bottle is $2 per unit. The water bottle is sold at a premium price of $12. To determine the break-even point of Company A’s premium water bottle:
Break Even Quantity = $100,000 / ($12 – $2) = 10,000
Therefore, given the fixed costs, variable costs, and selling price of the water bottles, Company A would need to sell 10,000 units of water bottles to break even.
For more information about variable costs, check out the following video:
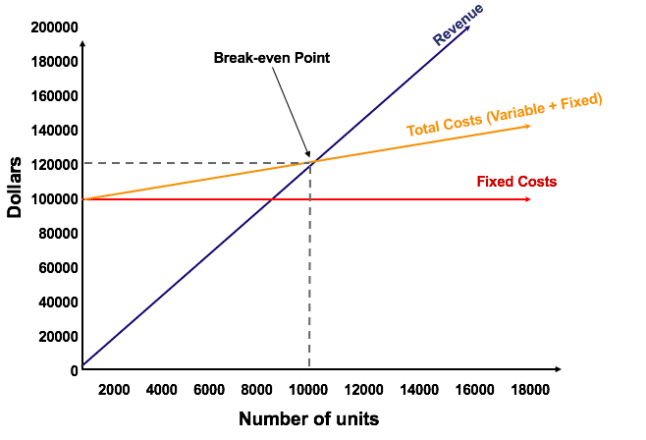
The graphical representation of unit sales and dollar sales needed to break even is referred to as the break-even chart or cost-volume-profit (CVP) graph. Below is the CVP graph of the example above:
As illustrated in the graph above, the point at which total fixed and variable costs are equal to total revenues is known as the break-even point. At the break-even point, a business neither makes a profit nor incurs a loss. Therefore, the break-even point is often referred to as the “no-profit” or “no-loss point.”
The break-even analysis is important to business owners and managers in determining how many units (or revenues) are needed to cover the fixed and variable expenses of the business.
Therefore, the concept of break-even point is as follows:
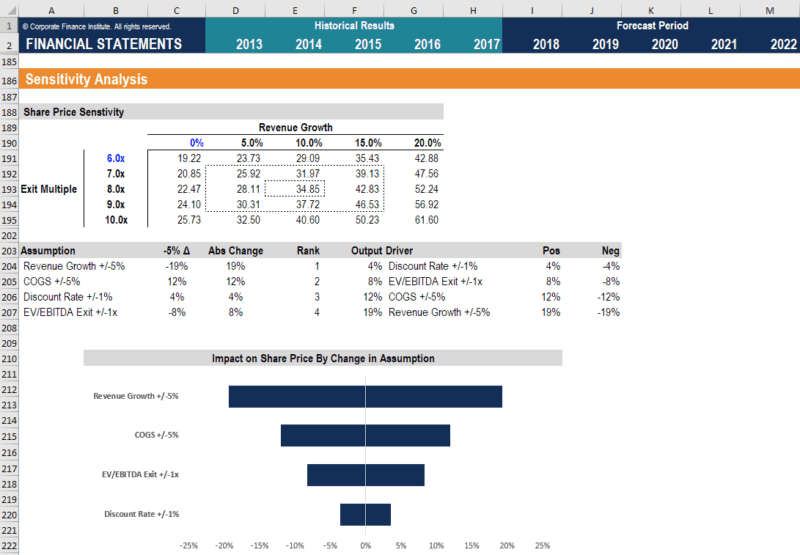
Break-even analysis is often a component of sensitivity analysis and scenario analysis performed in financial modeling. Using Goal Seek in Excel, an analyst can backsolve how many units need to be sold, at what price, and at what cost to break even.
It is important to calculate a company’s break-even point in order to know the minimum target to cover production expenses. However, there are times when the break-even point increases or decreases, depending on certain of the following factors:
When there is an increase in customer sales, it means that there is higher demand. A company then needs to produce more of its products to meet this new demand which, in turn, raises the break-even point in order to cover the extra expenses.
The hard part of running a business is when customer sales or product demand remains the same while the price of variable costs increases, such as the price of raw materials. When that happens, the break-even point also goes up because of the additional expense. Aside from production costs, other costs that may increase include rent for a warehouse, increases in salaries for employees, or higher utility rates.
In cases where the production line falters, or a part of the assembly line breaks down, the break-even point increases since the target number of units is not produced within the desired time frame. Equipment failures also mean higher operational costs and, therefore, a higher break-even.
In order for a business to generate higher profits, the break-even point must be lowered. Here are common ways of reducing it:
This is something that not all business owners want to do without hesitation, fearful that it may make them lose some customers.
Profitability may be increased when a business opts for outsourcing, which can help reduce manufacturing costs when production volume increases.
Every company is in business to make some type of profit. However, understanding the break-even number of units is critical because it enables a company to determine the number of units it needs to sell to cover all of the expenses it’s accrued during the process of creating and selling goods or services.
Once the break-even number of units is determined, the company then knows what sales target it needs to set in order to generate profit and reach the company’s financial goals.
Connect what you just learned to a clear career path with CFI’s role‑based courses and certification programs.


