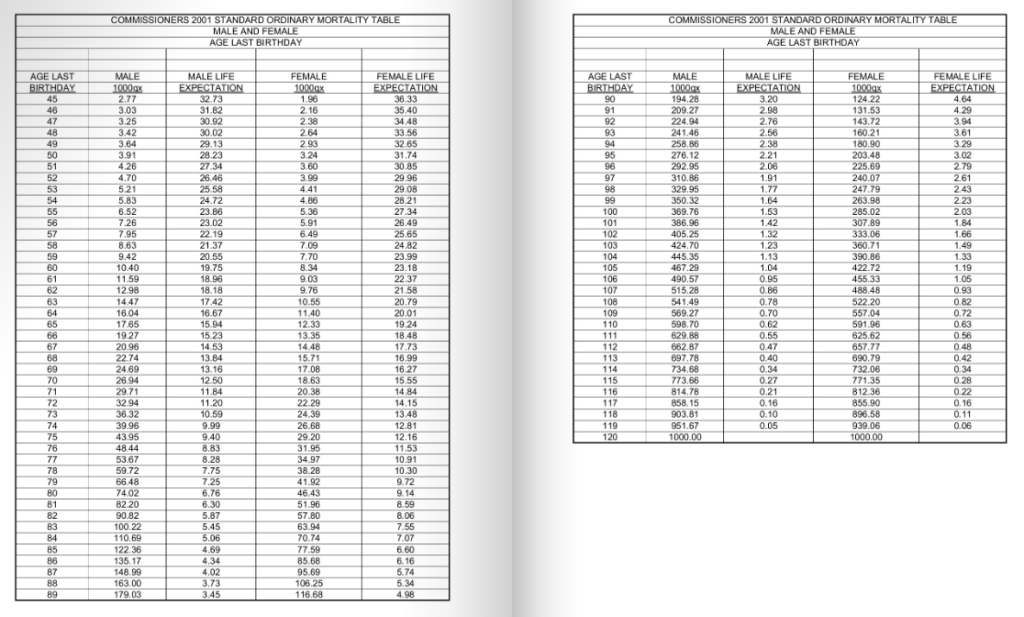
Mortality Table
A diagram that shows the death rate for a defined population within a specific rate of time
What is a Mortality Table?
A mortality table is a diagram that shows the death rate for a defined population within a specific rate of time. Also known as a life table or an actuarial table, mortality tables are used in business by insurance companies to price insurance products and schemes for individuals.
Also, mortality tables can be used to develop complex mathematical models that represent the survival rates of different populations. They are also useful in the study of biology and medicine. The tables can help in the development of diagnostic criteria for certain drugs, as well as the type of treatment an individual should receive.
Summary
- A mortality table is a diagram that shows the death rate for a defined population within a specific period of time. It predicts the likelihood that an individual will die within the current year.
- One type of mortality table is the period life table, which determines mortality rates for a specific population during a defined period of time.
- The second type of mortality table is the cohort life table, which determines the overall mortality rate of a group of people with the same year of birth (a cohort).
Features of Mortality Tables
Mortality tables are very complex grids of numbers that predict the probability that an individual will die before their next birthday for each age based on a selection of variables.
Using certain characteristics such as gender and age, mortality tables provide probabilities of death based on thousands or the number of people in a group of 1,000 expected to die within a certain year. They usually cover ages in one-year increments from birth through age 100, with the probability of death increasing with age.
Mortality tables usually consist of separate data for men and women due to the substantial difference in mortality rates and the average lifespan for each gender.
Several statistics can be drawn as a result, including:
- Probability of surviving past a particular year of age
- Remaining life expectancy for people at different ages
- Proportion of the original birth cohort still living
Types of Mortality Tables
There are two main types of mortality tables – the period life table and the cohort life table.
1. Period life table
The period life table determines mortality rates for a specific population during a defined period of time, such as a single year or a group of years. It also assumes that mortality rates apply throughout the remainder of a person’s life, and as such, it does not take into consideration any future developments or changes to mortality rates.
Period life tables are useful in measuring mortality rates over a specific period and enable statistics to be drawn objectively by comparing mortality rates and trends over time both among different regions of a country, as well as among different countries.
2. Cohort life table
Also known as a generation life table, the cohort life table determines the overall mortality rate of a group of people with the same year of birth (a cohort). It shows the probability for an individual from the given cohort dying at each age over the course of their lifespan.
The cohort life table is based on age-specific probabilities of one dying, which are determined using a combination of mortality data for the specific cohort from past years long with estimates about mortality rates for the cohort in the future.
The cohort life table takes into account evolutions in observed and estimated mortality rates for the cohort throughout its lifetime, and as a result, it is regarded as a more accurate and appropriate measure of how long a person of a certain age would be expected to live on average.
Since mortality rates constantly change over time as a result of the development in the global health of populations and can be negatively impacted by deadly global pandemics, cohort life tables are typically preferred over period life tables.
It should be noted, however, that cohort life tables typically involve an element of subjectivity, as it requires estimates of future mortality rates in their calculations and is therefore vulnerable to any errors that may plague the projections.
It does result in period life tables to be used in favor of cohort life tables to compare life expectancies of different population sub-groups or predict how long people with generally good health will live.
Using Mortality Tables in Business
In business, mortality tables are generally used by insurance agencies to determine prices for insurance products. It requires a thorough process involving not only insurance agents but also actuaries who need to develop projections of future insured events, such as death, sickness, and disability.
Actuaries are responsible for developing mathematical models of the rates and timings of events, such as death or sickness, by studying historical data of the occurrence of such events in the past.
Actuaries also take into account how expectations will evolve, as well as age and other population characteristics to derive expected rates of deaths, sickness, and disability for the future. It enables them to form a comparison between people at risk of death and those that actually die to determine the probability of death at each age.
As mentioned previously, mortality tables play a significant role in helping insurance agencies determine the prices of various insurance products. The collection and accurate use of data are pivotal in developing such tables to be deployed in the insurance industry, as the more accurate data one can find, the stronger the actuarial structure of the insurance company will be.
Mortality Tables as Projections – Uses in Public Health
Mortality tables serve as actuarial resources to make projections on matters of public health, which are used to generate policy and epidemiological strategy. The mathematical tools help to determine disease and survival outcomes that help to better educate doctors and patients involving health concerns and diseases they may have contracted.
The tables lead to better-educated patients who can help make more informed decisions that determine professional care and treatment options. It is important, as often, individuals find themselves in positions where they have to make difficult decisions regarding which types of treatment they are to receive when they are unexpectedly diagnosed with a potentially life-threatening disease.
More Resources
CFI offers the Commercial Banking & Credit Analyst (CBCA)™ certification program for those looking to take their careers to the next level. To keep learning and advancing your career, the following resources will be helpful:


