Arms Index (TRIN)
A short-term technical analysis trading indicator that compares the number of advancing and declining stocks issuance with the advancing and declining volume
What is the Arms Index?
The Arms Index, also known as the Short-Term Trading Index (TRIN), refers to a short-term technical analysis trading indicator that compares the number of advancing and declining stocks issues with the advancing and declining volume.
Summary
- The Arms Index, also known as the Short-Term Trading Index (TRIN), refers to a short-term technical analysis trading indicator that compares the number of advancing and declining stocks issues with the advancing and declining volume.
- There are three readings in the TRIN – at, below, or above 1.0.
- The Arms Index is an important indicator that is used in finance, but at the same time, it is often used in conjunction with other indices.
Arms Index Formula
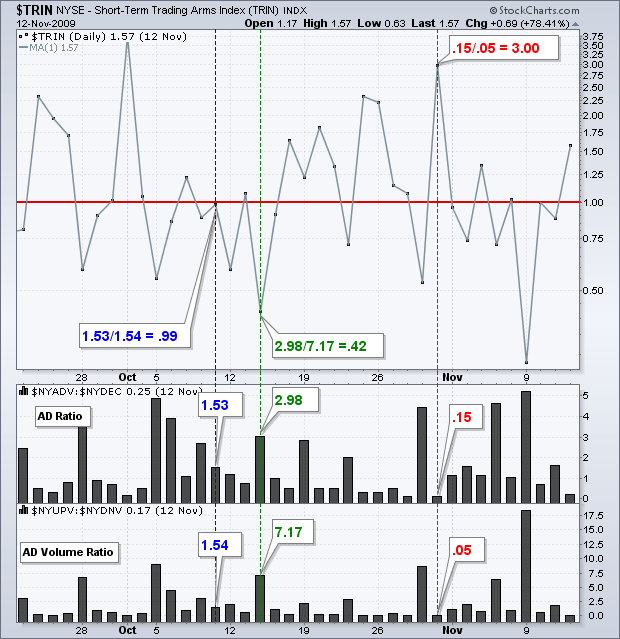
Developed by Richard W. Arms Jr. in 1967, the Arms Index is calculated by dividing the advancing/declining ratio (AD ratio) by the advancing/declining volume (AD volume). The value 1 is especially important here, as crossing it indicates whether the market is strong or weak.

The formula to calculate the TRIN Index is comprised of the following items:
- Advancing Stock: They are stock issues that have increased compared to previous readings.
- Declining Stock: They are stock issues that have decreased compared to previous readings.
- Advancing Volume: It is the number of stocks that have advanced.
- Declining Volume: It is the number of stocks that have declined.
A key component of the Arms Index is the Advance-Decline (AD) Ratio, which is the number of advancing stocks divided by the number of declining stocks.
How to Calculate the Arms Index?
The Arms Index can be calculated using various charting applications and software, but it can also be calculated by hand.
1. First, calculate the AD ratio (Advancing Stock divided by Declining Stock) at set intervals.
2. Calculate the AD Volume (Advancing Volume divided by Declining Volume).
3. Divide the AD Ratio by AD Volume.
4. Then, record the results, plot on a graph, and repeat the process at the next time interval.
5. The last step is to connect multiple data points to form a graph to see the movement of the TRIN over time.
TRIN Readings
The TRIN indicates three possible results. The value 1.0 is especially important here, as crossing it indicates whether the market is strong or weak.
The first result is an index value of 1.0, which means that the AD ratio is equal to the AD volume ratio, and the market is in a neutral state. The advancing volume is distributed evenly over the advancing issues, and the declining volume is evenly distributed over the declining issues.
The second result is a result of less than 1.0. It means that the AD Volume results in a higher ratio than the AD Ratio and is a strong indicator of a bull market. A TRIN reading below 1.0 usually results in a strong price advance, which is due to the strong volume in rising stocks.
The third result is a reading above 1.0. It means that the AD Volume results in a lower ratio than the AD ratio and is a strong indicator of a bear market. A TRIN reading above 1.0 results in a strong price decline due to the strong volume of declining stocks. In other words, there is a greater volume in the average declining stock than in the average advancing stock.
Importance of the Arms Index
The Arms Index plays an important role in finance – to the extent that the TRIN is displayed on the New York Stock Exchange’s central wall display continuously during trading hours. The Arms Index distinguishes itself from other indices by incorporating the volume of stocks into consideration. There are many indices available, and companies should use more than one to provide a more thorough analysis.
It is important to note that the farther away from 1 the TRIN reading is, the larger the contract between the buying and selling of stocks. Typically, a value exceeding 3 indicates an oversold market, and bearish sentiment is too dramatic. It might lead to an upward reversal in the prices in the near future. Also, a TRIN reading below 0.5 might mean that the market is overbought, and bullish sentiment is overheating.
It is important to refer to several indices instead of only one to get a better understanding of the situation. In addition, not only is the TRIN reading examined carefully, but the rate of change during the day is also looked at closely to see if the market may change directions in the future.
Arms Index Pros and Cons
As an oscillator, the Arms Index provides real-time information on the TRIN and enables the user to know when to buy or sell the stock in question. By separating the stocks into advancing and declining ones, the index is easy to read and understand. Its incorporation of stock volume is especially important to users.
However, there are also drawbacks to the Arms Index. For example, the system might include errors in the analysis and give false readings as a result. As such, the Arms Index needs to be used in conjunction with other indices to get cohesive results.
Related Readings
CFI is the official provider of the Capital Markets & Securities Analyst (CMSA®) certification program, designed to transform anyone into a world-class financial analyst.
In order to help you become a world-class financial analyst and advance your career to your fullest potential, these additional resources will be very helpful:


