Get Certified for
Capital Markets (CMSA®)
From equities and fixed income to derivatives, the CMSA certification bridges the gap from where you are now to where you want to be — a world-class capital markets analyst.
A financial modeling arrangement that is identified by a drastic reversal in price over the span of its distinct two-bar candlestick formation
A kicker pattern is a security’s price charting pattern that is identified by a drastic reversal in price over the span of its distinct two-bar candlestick formation. Kicker patterns are prominent in the technical analysis world because they act as predictors for changes in the direction of an asset’s price forecast.

The kicker pattern is severely magnified when it is seen in oversold and overbought markets. The impact of a kicker pattern suggests that large players in the financial market may be changing or altering their opinions on a security.
In most cases, the opinions of large players in the financial market are swayed during some news event or release of information. For example, if a CEO were to openly express a controversial political belief, investors may react strongly to sell or buy the underlying stock.
The two primary kicker patterns that are prominent in the financial market today are referred to as “bullish kicker patterns” and “bearish kicker patterns.”
In order to grasp the concept of the two most important kicker patterns in technical analysis, it is important to first understand the difference between a bull market and a bear market.
The animal reference taken on by the financial terms directly relates to the categorization of competing buyers (bulls) and sellers (bears) in the financial market.
Simply, a bull market is a market that shows uptrend expectations. Markets consist of large financial indexes, such as the S&P 500, NASDAQ, and the Dow Jones. The indexes are seen as bull markets when the price is rising.
The common characteristics of a bull market include:
Opposite to a bull market, a bear market is when the market declines.
The common characteristics of a bear market include:
Within the technical analysis world, there are two defined forms of kicker patterns that predict changes in an asset’s price.
A bullish kicker pattern indicates that the stock prices could be on the rise. Such an arrangement can be seen below:
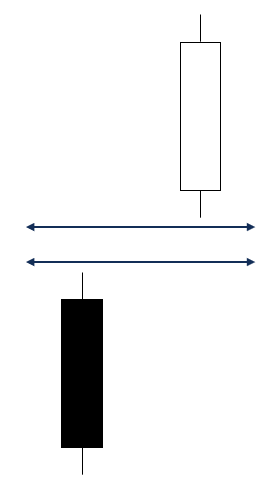
As shown, a bullish kicker pattern starts with a black (bearish) candlestick, which is then followed by a white (bullish) candlestick that opens above the black candlestick, creating a large upward gap.
The general consensus between traders is that the bullish kicker pattern is one of the most powerful and influential tools in technical analysis.
The one downside to the bullish kicker pattern is that they are extremely rare and only occur in very distinct situations and events.
Opposite from a bullish pattern, a bearish kicker pattern indicates that the stock prices could be on the decline. Such an arrangement is illustrated below:
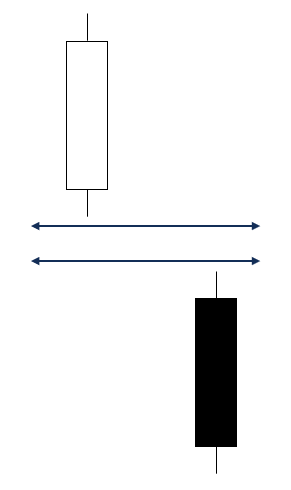
As shown, a bearish kicker pattern starts with a white (bullish) candlestick which is then followed by a black (bearish) candlestick that opens below the white candlestick, creating a large downward gap.
The bearish kicker pattern emphasizes the abruptness of the change in investor attitude.
CFI is the official provider of the global Capital Markets & Securities Analyst (CMSA)® certification program, designed to help anyone become a world-class financial analyst. To keep advancing your career, the additional CFI resources below will be useful:


