Get Certified for
Capital Markets (CMSA®)
From equities and fixed income to derivatives, the CMSA certification bridges the gap from where you are now to where you want to be — a world-class capital markets analyst.
Financial technical analysis tools that depict daily price movement information that is shown graphically on a candlestick chart
Candlestick patterns are a financial technical analysis tool that depicts daily price movement information that is shown graphically on a candlestick chart. A candlestick chart is a type of financial chart that shows the price movement of derivatives, securities, and currencies, presenting them as patterns.

Candlestick patterns typically represent one whole day of price movement, so there will be approximately 20 trading days with 20 candlestick patterns within a month. They serve a purpose as they help analysts to predict future price movements in the market based on historical price patterns.
As for quantity, there are currently 42 recognized candlestick patterns. All of which can be further broken into simple and complex patterns.
Financial technical analysis is a study that takes an ample amount of education and experience to master. For simplicity, we will be talking about the basic patterns to be aware of when viewing candlestick charts and what the patterns may be predictive regarding price movements.
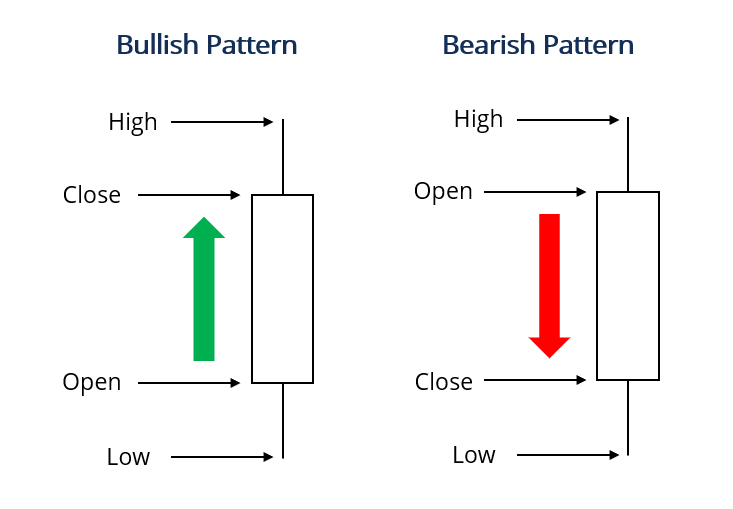
Before delving into the implications of each pattern, it is important to understand the difference between bullish and bearish patterns. For reference, Bloomberg presents bullish patterns in green and bearish patterns in red.
Bearish patterns are a type of candlestick pattern where the closing price for the period of a stock is lower than the opening price. This creates immediate selling pressure for the investor due to a price decline assumption.
Bullish patterns are a type of candlestick pattern where the closing price for the period of a stock was higher than the opening price. This creates buying pressure for the investor due to potential continued price appreciation.
Presented as a single candle, a bullish hammer (H) is a type of candlestick pattern that indicates a reversal of a bearish trend. This candlestick formation implies that there may be a potential uptrend in the market.
Some of the identifiable traits and features of a bullish hammer include the following:
A bullish candlestick pattern is a useful tool because it may motivate investors to enter a long position to capitalize on the suggested upward movement.
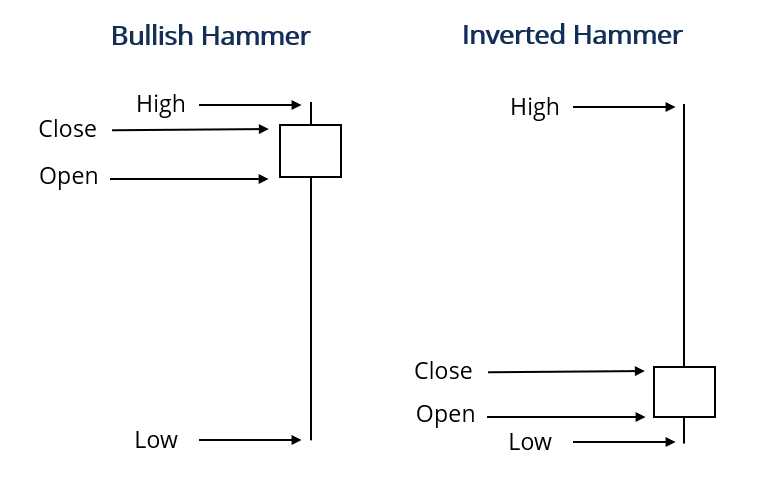
Also presented as a single candle, the inverted hammer (IH) is a type of candlestick pattern that indicates when a market is trying to determine a bottom. As the name suggests, the inverted hammer shares the same design as the bullish hammer candlestick pattern, except it is flipped invertedly.
An inverted hammer candlestick pattern may be presented as either green or red. Green indicates a stronger bullish sign compared to a red inverted hammer.
Some of the identifiable traits and features of an inverted hammer include the following:
In comparison, both the bullish hammer and the inverted hammer candlestick pattern are similar in nature. But each design signifies a slightly different directional trend.
An engulfing line (EL) is a type of candlestick pattern represented as both a bearish and bullish trend and indicates trend continuation.
In order to be a bearish engulfing line, the first candle must be bullish in nature, while the second candle must be bearish and must be “engulfing” the first bullish candle.
Comparatively, a bullish engulfing line consists of the first candle being bearish while the second candle must be bullish and must also be “engulfing” the first bearish candle.
This is shown in detail with the diagram below:
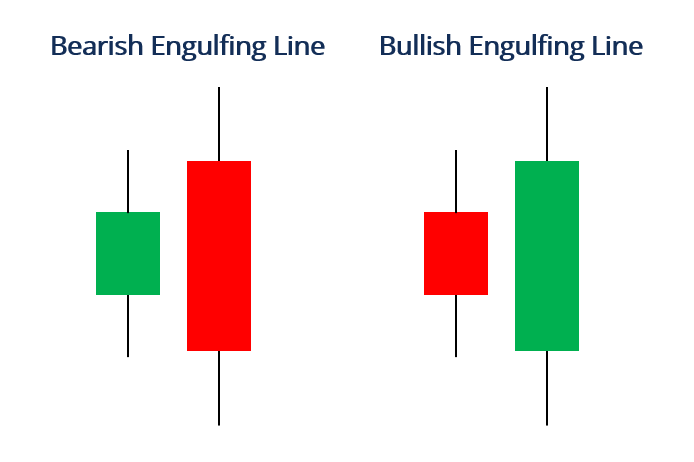
As for financial indication, a bearish engulfing line represents a bearish trend continuation (lower prices to come), while a bullish engulfing line suggests a bullish trend continuation (higher prices to come).
The Harami (HR) candlestick is a Japanese candlestick pattern that may suggest either potential price reversal or bearish/bullish trend continuation. Translated from Japanese, Harami means “pregnant,” shown through the first candle, which is considered “pregnant.”
The Harami candlestick is identified by two candles, the first of which being larger than the other “pregnant,” similarly to the engulfing line, except opposite.
This is shown for both a bearish situation and a bullish situation.
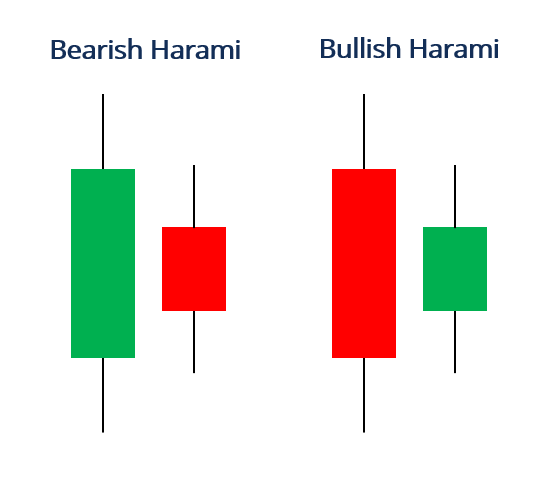
When there is a bearish Harami candlestick present in the market, this may suggest a potential downward price reversal in the near future.
As for a bullish Harami, this candlestick formation may suggest that a bearish trend may be coming to an end, which can result in some upward (bullish) price reversal.
The piercing line (PL) is a type of candlestick pattern occurring over two days and represents a potential bullish reversal in the market.
For further clarification and learning, a bullish reversal would indicate a potential reversal from a downward trend in price to an upward trend in price.
Three important characteristics of the piercing line exist. There must be a downward trend before the pattern, a gap after the first day, and an evident reversal on the second-day candlestick in the pattern.
For reference, there is a diagram depicting what a piercing line may look like.
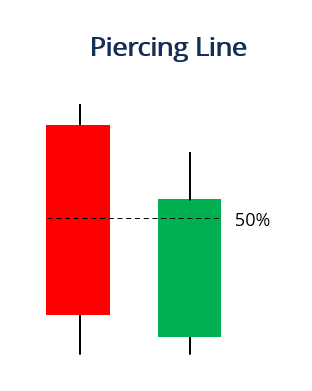
Most commonly, the piercing line pattern is located at the bottom of a downtrend. Considering prices are experiencing a downward motion, it prompts buyers to influence a trend reversal in order to push prices higher.
The positioning of the two candlesticks is important. The second-day candlestick must have an opening lower than the first-day bearish candle. As mentioned, the downtrend causes buyers to drive the price higher, which should be above 50% of the first-day candlestick.
Overall, the piercing line is a lucrative financial analysis candlestick that is much more commonly accepted and studied than other patterns.
Connect what you just learned to a clear career path with CFI’s role‑based courses and certification programs.
To keep learning and advance your career, the following resources will be helpful:


