Crossover Rate

Discount rate for equal NPVs

What is the Crossover Rate?

Crossover Rate is the rate of return (alternatively called the weighted average cost of capital) at which the Net Present Values (NPV) of two projects are equal. It represents the rate of return at which the net present value profile of one project intersects the net present value profile of another project.

In capital budgeting analysis exercises, the crossover rate is used to show when one investment project becomes superior to another as a result of a change in the rate of return (cost of capital).

Crossover Rate Formula

Consider the following example. An investor is faced with 2 investment projects: Project ABC and Project XYZ. Project ABC has an initial investment of A0 and will generate a steady stream of income over a 3-year period. The cash flows from Project ABC at the end of the first, second, and third years are denoted by C1, C2, and C3, respectively. Thus, the Net Present Value of Project ABC is as follows:

NPV of ABC

Project XYZ has an initial investment of X0 and will generate a steady stream of income over a 2-year period. The cash flows from Project XYZ at the end of the first and second years are denoted by Z1 and Z2, respectively. Thus, the Net Present Value of Project XYZ is as follows:

NPV of XYZ

The crossover rate is defined as the rate of return at which the NPVABC = NPVXYZ. Since C1, C2, C3, A0, Z1, Z2, and X0 are all known, we can solve for the crossover rate.

Alternative Method of Calculating Crossover Rate

  1. Determine the cash flow streams of the two projects.
  2. Find the difference in the initial investments between the two projects.
  3. Find the difference in the cash flow in each period between the two projects. (After a project ends, it generates zero cash flow in all subsequent periods).
  4. Develop an IRR equation by equating the net present value equation of the resulting differential cash flows to zero.
  5. Solve the equation for r.

Numerical Example

Let us continue with the example above. An investor is faced with 2 investment projects: Project ABC and Project XYZ. The first project, Project ABC costs $5 million and will result in a cash flow of $6 million at the end of the first year, $4 million at the end of the second year, and $2 million at the end of the third year. The second project, Project XYZ costs $8 million but will generate a cash flow of $25 million at the end of the second year.

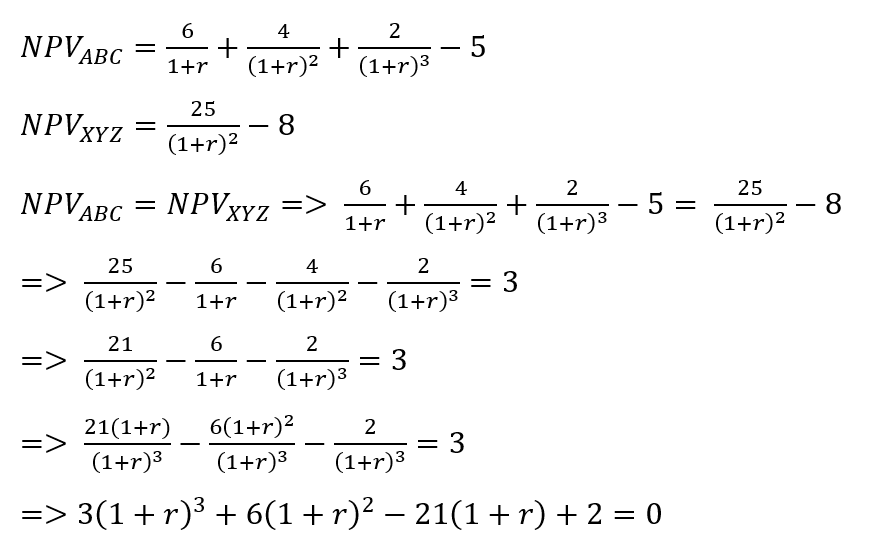
crossover rate formula

For simplicity let 1+r = v. Therefore, the above equation reduces to the following:

We can solve the above equation using the cubic formula. Because it is a cubic equation, it will have 3 roots that satisfy it. For the above equation v= -3.85, 1.76, and 0.098. Therefore, 1+r = -3.85, 1.76, or 0.098. Since the rate of return can never be negative, we can ignore the first and the third root. Therefore 1+r = 1.76 or r=0.76 or 76%.

Graphical Solution to the Numerical Problem

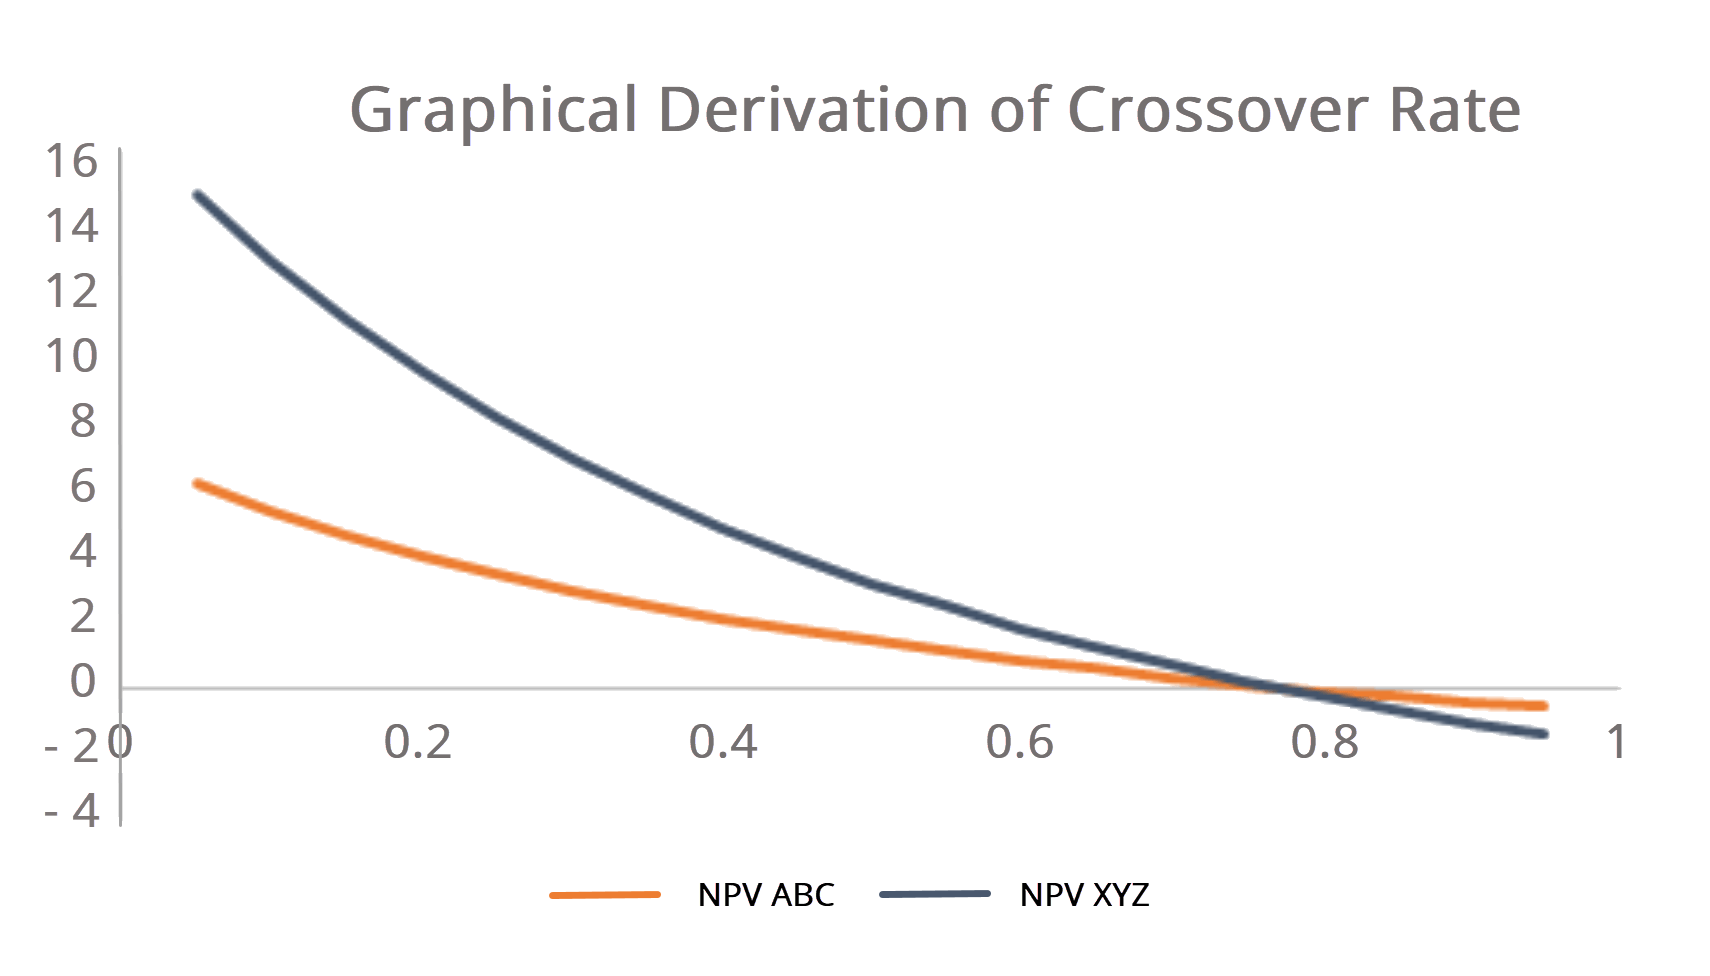
We can arrive at the above solution using software such as Microsoft Excel and plot the NPV profiles of the two different projects and observe their point of intersection.

r NPVABC NPVXYZ
0.05 6.070078825 14.67573696
0.1 5.26296018 12.66115702
0.15 4.556998438 10.90359168
0.2 3.935185185 9.361111111
0.25 3.384 8
0.3 2.892580792 6.792899408
0.35 2.452116039 5.717421125
0.4 2.055393586 4.755102041
0.45 1.69646152 3.890606421
0.5 1.37037037 3.111111111
0.55 1.07297506 2.405827263
0.6 0.80078125 1.765625
0.65 0.550825055 1.182736455
0.7 0.320578058 0.650519031
0.75 0.10787172 0.163265306
0.8 -0.089163237 -0.283950617
0.85 -0.272145776 -0.695398101
0.9 -0.442484327 -1.074792244
0.95 -0.601409329 -1.425378041

crossover rate graph

From the above graph, we can see that the two NPV profiles intersect with each other at around r=0.76 or 76%, which is the same answer that we got when we solved the cubic equation. Thus, if the rate of return or cost of capital is less than 0.76, Project XYZ is superior to Project ABC. However, if the rate of return is more than 0.76, Project ABC is superior to Project XYZ.

Download the Free Template

Enter your name and email in the form below and download the free template now!

Crossover Rate Template

Download the free Excel template now to advance your finance knowledge!

Thanks for reading CFI’s guide to the crossover rate. To keep advancing your career, the additional CFI resources below will be useful:

0 search results for ‘