EV/EBITDA is a ratio that compares a company’s Enterprise ValueEnterprise ValueEnterprise Value, or Firm Value, is the entire value of a firm equal to its equity value, plus net debt, plus any minority interest, used in valuation. It looks at the entire market value rather than just the equity value, so all ownership interests and asset claims from both debt and equity are included. (EV) to its Earnings Before Interest, Taxes, Depreciation & Amortization (EBITDAEBITDAEBITDA or Earnings Before Interest, Tax, Depreciation, Amortization is a company's profits before any of these net deductions are made. EBITDA focuses on the operating decisions of a business because it looks at the business’ profitability from core operations before the impact of capital structure. Formula, examples). The EV/EBITDA ratio is commonly used as a valuation metric to compare the relative value of different businesses.
In this guide, we will break down the EV/EBTIDA multiple into its various components, and walk you through how to calculate it step by step. Learn more in CFI’s Business Valuation Techniques course.
What is the EV/EBITDA multiple used for?
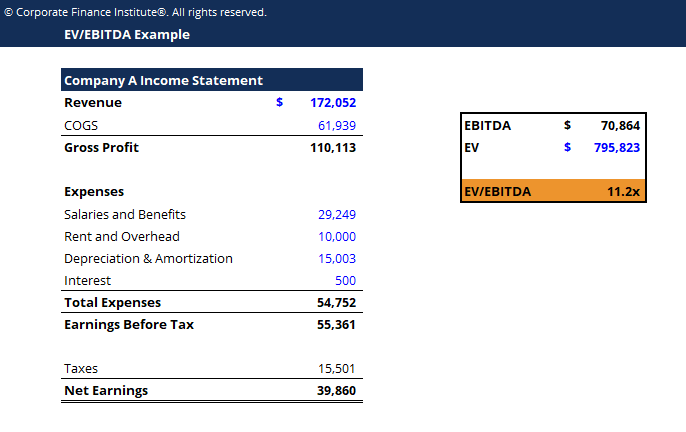
The ratio of EV/EBITDA is used to compare the entire value of a business with the amount of EBITDAEBITDAEBITDA or Earnings Before Interest, Tax, Depreciation, Amortization is a company's profits before any of these net deductions are made. EBITDA focuses on the operating decisions of a business because it looks at the business’ profitability from core operations before the impact of capital structure. Formula, examples it earns on an annual basis. This ratio tells investors how many times EBITDA they have to pay, were they to acquire the entire business.
The most common uses of EV/EBITDA are:
To determine what multiple a company is currently trading at (I.e 8x)
To compare the valuation of multiple companies (i.e. 6x, 7.5x, 8, and 5.5x across a group)
To calculate the terminal value in a Discounted Cash Flow DCF model
In negotiations for the acquisition of a private business (i.e. the acquirer offers 4x EBITDA)
In calculating a target price for a company in an equity research report
EV stands for Enterprise Value and is the numerator in the EV/EBITDA ratio. A firm’s EV is equal to its equity value (or market capitalization) plus its debt (or financial commitments) less any cash (debt less cash is referred to as net debtNet DebtNet debt = total debt - cash. It is a financial liquidity metric that measures a company’s ability to pay its debts if they were due today. In other words, net debt compares a company’s total debt with its cash position. It is used in valuation to calculate the enterprise value of a firm).
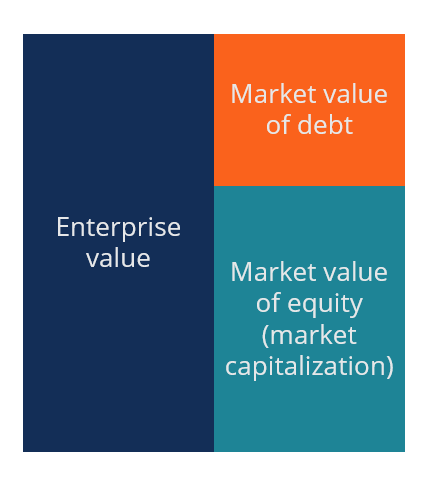
To learn more, see our guide to Enterprise Value vs Equity ValueEnterprise Value vs Equity ValueEnterprise value vs equity value. This guide explains the difference between the enterprise value (firm value) and the equity value of a business. See an example of how to calculate each and download the calculator. Enterprise value = equity value + debt - cash. Learn the meaning and how each is used in valuation.
What is EBITDA?
EBITDAEBITDAEBITDA or Earnings Before Interest, Tax, Depreciation, Amortization is a company's profits before any of these net deductions are made. EBITDA focuses on the operating decisions of a business because it looks at the business’ profitability from core operations before the impact of capital structure. Formula, examples stands for Earnings Before Interest Taxes Depreciation and Amortization. It often used in valuation as a proxy for cash flowCash FlowCash Flow (CF) is the increase or decrease in the amount of money a business, institution, or individual has. There are several types of Cash Flow., although for many industries it is not a useful metric.
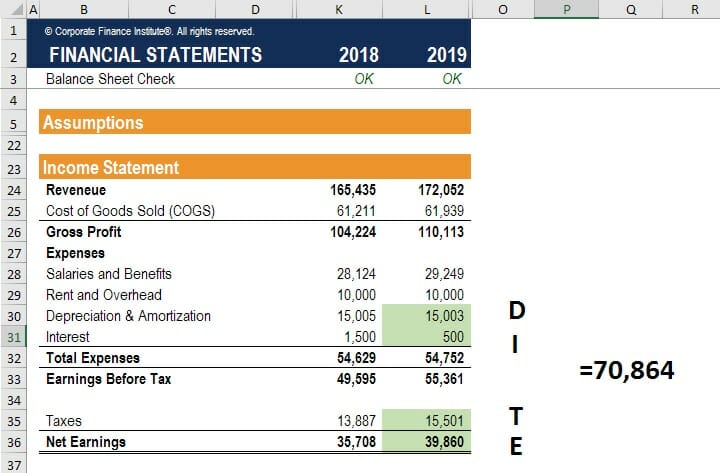
To learn more, read our Ultimate Cash Flow GuideValuationFree valuation guides to learn the most important concepts at your own pace. These articles will teach you business valuation best practices and how to value a company using comparable company analysis, discounted cash flow (DCF) modeling, and precedent transactions, as used in investment banking, equity research,.
EV/EBITDA in a Comps Table
The most common way to see the EV/EBITDA multiple displayed is in a comparable company analysisComparable Company AnalysisHow to perform Comparable Company Analysis. This guide shows you step-by-step how to build comparable company analysis ("Comps"), includes a free template and many examples. Comps is a relative valuation methodology that looks at ratios of similar public companies and uses them to derive the value of another business (referred to as Comps for short).
Below is an example of the EV/EBITDA ratios for each of the 5 companies in the beverage industry. As you will see by the red lines highlighting the relevant information, by taking the EV column and dividing it by the EBITDA column, one arrives at the EV/EBITDA column.
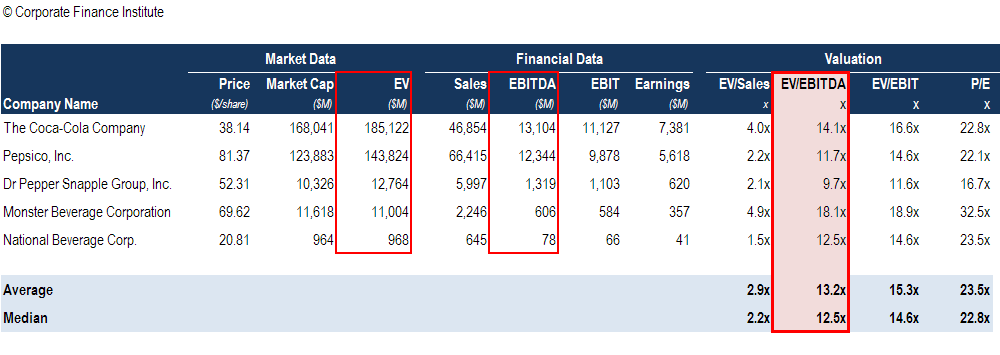
An analyst looking at this table may make several conclusions, depending on what other information they have about the company. For example, Monster Beverage has the highest EV/EBITDA multiple which could be because it has the highest growth rate, is considered the lowest risk, has the best management team, and so on.
Pros and cons of EV/EBITDA
There are many pros and cons to using this ratio. As with most things, whether or not it is considered a “good” metric depends on the specific situation.
Pros include:
Easy to calculate with publicly available information
Widely used and referenced in the financial community
Works well for valuing stable, mature businesses with low capital expenditures
Good for comparing relative values of different businesses
Cons include:
Many not be a good proxy for cash flow
Does not take into account capital expendituresHow to Calculate CapEx - FormulaThis guide shows how to calculate CapEx by deriving the CapEx formula from the income statement and balance sheet for use in financial modeling and analysis. To calculate capital expenditures, use depreciation on the income statement, add current period PP&E and subtract prior period PP&E
Hard to adjust for different growth rates
Hard to justify observed “premiums” and “discounts” (mostly subjective)
The best way to learn is by doing. If you want to calculate Enterprise Value to EBITDA ratios for a group of companies, follow these steps and try on your own.
10 steps to calculate EV/EBITDA and value a company:
Pick an industry (i.e. the beverage industry, as in our example)
Find 5-10 companies that you believe are similar enough to compare
Research each company and narrow your list by eliminating any companies that are too different to be comparable (i.e. too big/small, different product mix, different geographic focus, etc.)
Gather 3 years of historical financial information for each company (i.e. revenue, gross profit, EBITDA, and EPSEarnings Per Share (EPS)Earnings per share (EPS) is a key metric used to determine the profit for the common shareholder's on a per share basis. Earnings per share measure each common share’s profit allocation in relation to the company’s total profit and can be calculated based on basic shares outstanding or fully diluted shares outstanding)
Gather current market data for each company (i.e. share price, number of shares outstandingWeighted Average Shares OutstandingWeighted average shares outstanding refers to the number of shares of a company calculated after adjusting for changes in the share capital over a reporting period. The number of weighted average shares outstanding is used in calculating metrics such as Earnings per Share (EPS) on a company's financial statements, and net debt)
Calculate the current EV for each company (i.e. market capitalizationMarket CapitalizationMarket Capitalization (Market Cap) is the most recent market value of a company’s outstanding shares. Market Cap is equal to the current share price multiplied by the number of shares outstanding. The investing community often uses the market capitalization value to rank companies plus net debt)
Divide EV by EBITDA for each of the historical years of financial data you gathered
Compare the EV/EBITDA multiples for each of the companies
Determine why companies have a premium or discounted EV/EBITDA ratio
Make a conclusion about what EV/EBITDA multiple is appropriate for the company you’re trying to value
Download CFI’s free EV to EBITDA Excel Template to calculate the ratio and play with some examples on your own.
The above template is designed to give you a simple example how the math on the ratio works and calculate some examples yourself!
Download the Free Template
Enter your name and email in the form below and download the free template now!
More valuation resources
We hope this has been a useful guide to calculating Enterprise Value to EBITDA and better understanding the various pros and cons of using this valuation multiple. At CFI, we’re on a mission to help you advance your career, and with that in mind, we’ve created these additional resources to help you on your path to becoming a world-class financial analyst and earn your Financial Modeling & Valuation Analyst (FMVA)TMFMVA® CertificationThe Financial Modeling & Valuation Analyst (FMVA)® accreditation is a global standard for financial analysts that covers finance, accounting, financial modeling, valuation, budgeting, forecasting, presentations, and strategy. designation.
Relevant resources include:
Valuation methodsValuation MethodsWhen valuing a company as a going concern there are three main valuation methods used: DCF analysis, comparable companies, and precedent transactions. These methods of valuation are used in investment banking, equity research, private equity, corporate development, mergers & acquisitions, leveraged buyouts and finance
Financial modeling guideFree Financial Modeling GuideThis financial modeling guide covers Excel tips and best practices on assumptions, drivers, forecasting, linking the three statements, DCF analysis, Excel modeling and much more. Designed to be the best free modeling guide for analysts by using examples and step by step instructions. Investment banking, FP&A, research
DCF modelingDCF Model Training Free GuideA DCF model is a specific type of financial model used to value a business. DCF stands for Discounted Cash Flow, so the model is simply a forecast of a company’s unlevered free cash flow discounted back to today’s value. This free DCF model training guide will teach you the basics, step by step with examples and images
The Analyst TrifectaThe Analyst Trifecta® GuideThe ultimate guide on how to be a world-class financial analyst. Do you want to be a world-class financial analyst? Are you looking to follow industry-leading best practices and stand out from the crowd? Our process, called The Analyst Trifecta® consists of analytics, presentation & soft skills