The Price Earnings Ratio (P/E Ratio) is the relationship between a company’s stock price and earnings per share (EPS)Earnings Per Share Formula (EPS)EPS is a financial ratio, which divides net earnings available to common shareholders by the average outstanding shares over a certain period of time. The EPS formula indicates a company’s ability to produce net profits for common shareholders.. It is a popular ratio that gives investors a better sense of the valueFair ValueFair value refers to the actual value of an asset - a product, stock, or security - that is agreed upon by both the seller and the buyer. Fair value is applicable to a product that is sold or traded in the market where it belongs or under normal conditions - and not to one that is being liquidated. of the company. The P/E ratio shows the expectations of the market and is the price you must pay per unit of current earningsNet IncomeNet Income is a key line item, not only in the income statement, but in all three core financial statements. While it is arrived at through (or future earnings, as the case may be).
Earnings are important when valuing a company’s stock because investors want to know how profitable a company is and how profitableProfit MarginIn accounting and finance, profit margin is a measure of a company's earnings relative to its revenue. The three main profit margin metrics it will be in the future. Furthermore, if the company doesn’t grow and the current level of earnings remains constant, the P/E can be interpreted as the number of years it will take for the company to pay back the amount paid for each share.
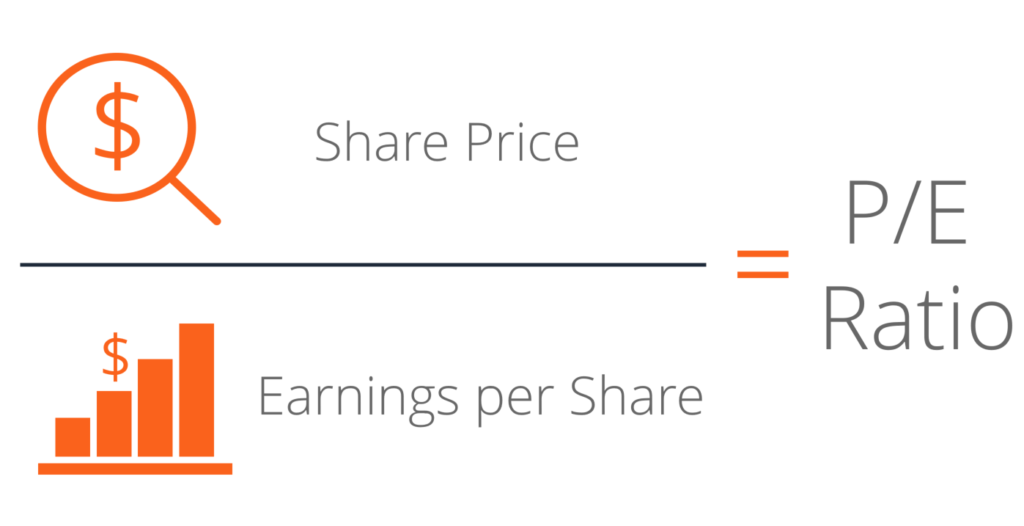
Looking at the P/E of a stock tells you very little about it if it’s not compared to the company’s historical P/E or the competitor’s P/E from the same industry. It’s not easy to conclude whether a stock with a P/E of 10x is a bargain, or a P/E of 50x is expensive without performing any comparisons.
The beauty of the P/E ratio is that it standardizes stocksStockWhat is a stock? An individual who owns stock in a company is called a shareholder and is eligible to claim part of the company’s residual assets and earnings (should the company ever be dissolved). The terms "stock", "shares", and "equity" are used interchangeably. of different prices and earnings levels.
The P/E is also called an earnings multiple. There are two types of P/E: trailing and forward. The former is based on previous periods of earnings per share, while a leading or forward P/E ratioForward P/E RatioThe Forward P/E ratio divides the current share price by the estimated future earnings per share. P/E ratio example, formula, and Excel template. is when EPS calculations are based on future estimates, which predicted numbers (often provided by management or equity research analystsEquity Research AnalystAn equity research analyst provides research coverage of public companies and distributes that research to clients. We cover analyst salary, job description, industry entry points, and possible career paths.).
Price Earnings Ratio Formula
P/E = Stock Price Per Share / Earnings Per Share
or
P/E = Market Capitalization / Total Net Earnings
or
Justified P/E = Dividend Payout Ratio / R – G
where;
R = Required Rate of Return
G = Sustainable Growth Rate
P/E Ratio Formula Explanation
The basic P/E formula takes the current stock price and EPS to find the current P/E. EPS is found by taking earnings from the last twelve months divided by the weighted average shares outstandingWeighted Average Shares OutstandingWeighted average shares outstanding refers to the number of shares of a company calculated after adjusting for changes in the share capital over a reporting period. The number of weighted average shares outstanding is used in calculating metrics such as Earnings per Share (EPS) on a company's financial statements. Earnings can be normalizedNormalizationFinancial statements normalization involves adjusting non-recurring expenses or revenues in financial statements or metrics so that they only reflect the usual transactions of a company. Financial statements often contain expenses that do not constitute a company's normal business operations for unusual or one-off items that can impact earningsNet IncomeNet Income is a key line item, not only in the income statement, but in all three core financial statements. While it is arrived at through abnormally. Learn more about normalized EPSNormalized EPSNormalized EPS refers to adjustments made to the income statement to reflect the up and down cycles of the economy..
The justified P/E ratioJustified Price to Earnings RatioThe justified price to earnings ratio is the price to earnings ratio that is "justified" by using the Gordon Growth Model. This version of the popular P/E ratio uses a variety of underlying fundamental factors such as cost of equity and growth rate. is used to find the P/E ratio that an investor should be paying for, based on the companies dividend and retention policy, growth rate, and the investor’s required rate of returnWACCWACC is a firm’s Weighted Average Cost of Capital and represents its blended cost of capital including equity and debt. The WACC formula is = (E/V x Re) + ((D/V x Rd) x (1-T)). This guide will provide an overview of what it is, why its used, how to calculate it, and also provides a downloadable WACC calculator. Comparing justified P/E to basic P/E is a common stock valuation method.Valuation MethodsWhen valuing a company as a going concern there are three main valuation methods used: DCF analysis, comparable companies, and precedent
Why Use the Price Earnings Ratio?
Investors want to buy financially sound companies that offer a good return on investment (ROI)ROI Formula (Return on Investment)Return on investment (ROI) is a financial ratio used to calculate the benefit an investor will receive in relation to their investment cost. It is most commonly measured as net income divided by the original capital cost of the investment. The higher the ratio, the greater the benefit earned.. Among the many ratios, the P/E is part of the research processEquity Research AnalystAn equity research analyst provides research coverage of public companies and distributes that research to clients. We cover analyst salary, job description, industry entry points, and possible career paths. for selecting stocks, because we can figure out whether we are paying a fair price. Similar companies within the same industry are grouped together for comparison, regardless of the varying stock prices. Moreover, it’s quick and easy to use when we’re trying to value a company using earnings. When a high or a low P/E is found, we can quickly assess what kind of stock or company we are dealing with.
High P/E
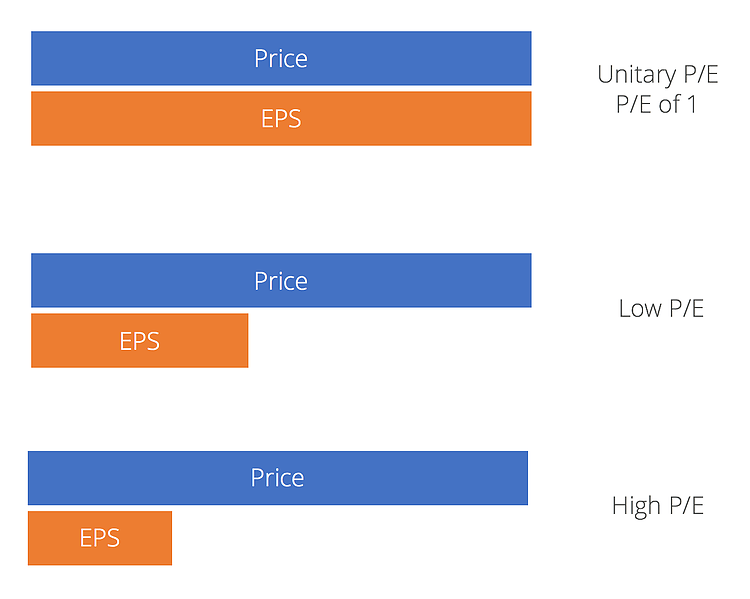
Companies with a high Price Earnings Ratio are often considered to be growth stocks. This indicates a positive future performance, and investors have higher expectations for future earnings growth and are willing to pay more for them. The downside to this is that growth stocks are often higher in volatility and this puts a lot of pressure on companies to do more to justify their higher valuation. For this reason, investing in growth stocks will more likely be seen as a riskyRisk AversionRisk aversion refers to the tendency of an economic agent to strictly prefer certainty to uncertainty. An economic agent exhibiting risk aversion is said to be risk averse. Formally, a risk averse agent strictly prefers the expected value of a gamble to the gamble itself. investment. Stocks with high P/E ratios can also be considered overvalued.
Low P/E
Companies with a low Price Earnings Ratio are often considered to be value stocks. It means they are undervalued because their stock price trade lower relative to its fundamentals. This mispricing will be a great bargain and will prompt investors to buy the stock before the market corrects it. And when it does, investors make a profit as a result of a higher stock price. Examples of low P/E stocks can be found in mature industries that pay a steady rate of dividendsDividendA dividend is a share of profits and retained earnings that a company pays out to its shareholders. When a company generates a profit and accumulates retained earnings, those earnings can be either reinvested in the business or paid out to shareholders as a dividend..
P/E Ratio Example
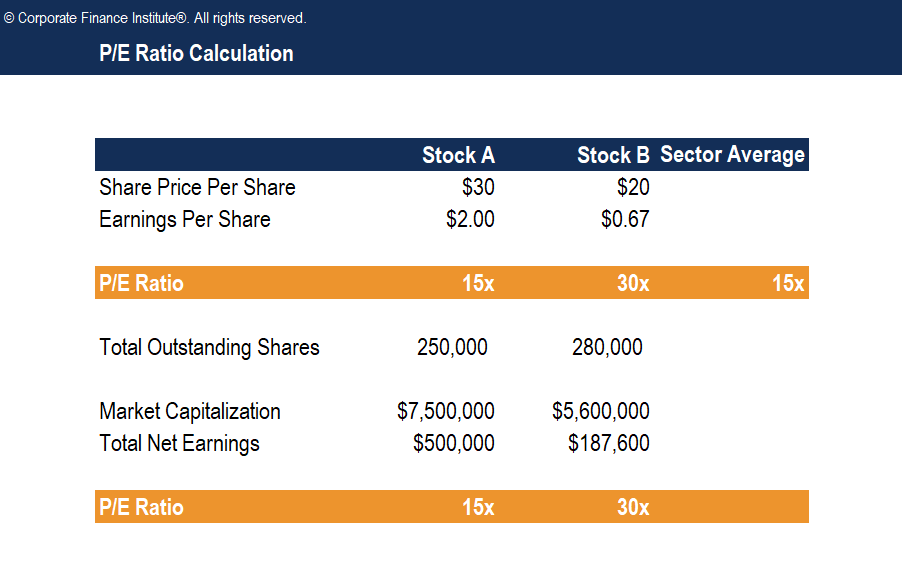
If Stock A is trading at $30 and Stock B at $20, Stock A is not necessarily more expensive. The P/E ratio can help us determine, from a valuation perspective, which of the two is cheaper.
If the sector’s average P/E is 15, Stock A has a P/E = 15 and Stock B has a P/E = 30, stock A is cheaper despite having a higher absolute price than Stock B because you pay less for every $1 of current earnings. However, Stock B has a higher ratio than both its competitor and the sector. This might mean that investors will expect higher earnings growth in the future relative to the market. The P/E ratio is just one of the many valuation measures and financial analysis tools that we use to guide us in our investment decision, and it shouldn’t be the only one.
Download the Free Template
Enter your name and email in the form below and download the free template now!
Video Explanation of the Price Earnings Ratio
Below is a short video that explains how to calculate a company’s price to earnings ratio, and how to interpret the results.
The justified P/E ratioJustified Price to Earnings RatioThe justified price to earnings ratio is the price to earnings ratio that is "justified" by using the Gordon Growth Model. This version of the popular P/E ratio uses a variety of underlying fundamental factors such as cost of equity and growth rate. above is calculated independently of the standard P/E. In other words, the two ratios should produce two different results. If the P/E is lower than the justified P/E ratio, the company is undervalued and purchasing the stock will result in profits if the alphaAlphaAlpha is a measure of the performance of an investment relative to a suitable benchmark index such as the S&P 500. An alpha of one (the baseline value is zero) shows that the return on the investment during a specified time frame outperformed the overall market average by 1%. is closed.
Limitations of Price Earnings Ratio
Finding the true value of a stock cannot just be calculated using current year earnings. The value depends on all expected future cash flowsCash FlowCash Flow (CF) is the increase or decrease in the amount of money a business, institution, or individual has. In finance, the term is used to describe the amount of cash (currency) that is generated or consumed in a given time period. There are many types of CF and earnings of a company. Price Earnings Ratio is used as a good starting point. It means little just by itself unless we have some understanding of the growth prospects in EPS and risk profile of the company. An investor must dig deeper into the company’s financial statementsThree Financial StatementsThe three financial statements are the income statement, the balance sheet, and the statement of cash flows. These three core statements are and use other valuation and financial analysis methodsTypes of Financial AnalysisFinancial analysis involves using financial data to assess a company’s performance and make recommendations about how it can improve going forward. Financial Analysts primarily carry out their work in Excel, using a spreadsheet to analyze historical data and make projections Types of Financial Analysis to get a better picture of a company’s value and performance.
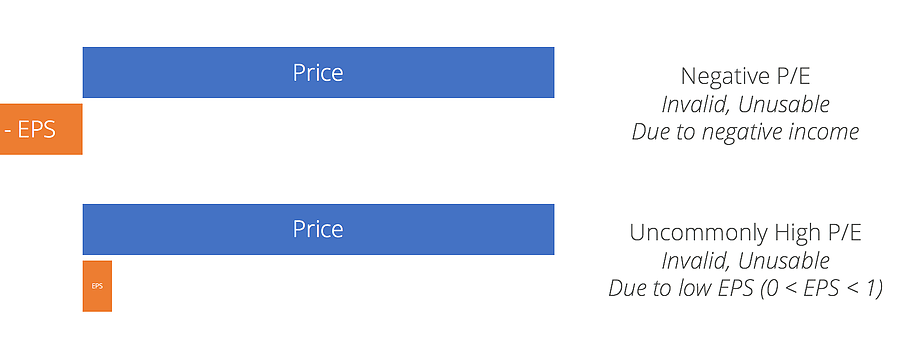
Additionally, the Price Earnings Ratio can produce wonky results as demonstrated below. Negative EPS resulting from a loss in earnings will produce a negative P/E. An exceedingly high P/E can be generated by a company with close to zero net income, resulting in a very low EPS in the decimals.
Additional Resources
CFI is the official global provider of the Financial Modeling DesignationFMVA® CertificationJoin 350,600+ students who work for companies like Amazon, J.P. Morgan, and Ferrari for financial analysts. To continue learning and advancing your career, these additional resources will be helpful:
Financial Modeling GuideFree Financial Modeling GuideThis financial modeling guide covers Excel tips and best practices on assumptions, drivers, forecasting, linking the three statements, DCF analysis, more
Income Statement TemplateIncome StatementThe Income Statement is one of a company's core financial statements that shows their profit and loss over a period of time. The profit or
Balance SheetBalance SheetThe balance sheet is one of the three fundamental financial statements. These statements are key to both financial modeling and accounting
PEG RatioPEG RatioPEG Ratio is the P/E ratio of a company divided by the forecasted Growth in earnings (hence "PEG"). It is useful for adjusting high growth companies. The ratio adjusts the traditional P/E ratio by taking into account the growth rate in earnings per share that are expected in the future. Examples, and guide to PEG