Get Certified for
Business Intelligence (BIDA®)
Develop analytical superpowers by learning how to use programming and data analytics tools such as VBA, Python, Tableau, Power BI, Power Query, and more.
The estimation of relationships between a dependent variable and one or more independent variables
Regression analysis is a set of statistical methods used for the estimation of relationships between a dependent variable and one or more independent variables. It can be utilized to assess the strength of the relationship between variables and for modeling the future relationship between them.
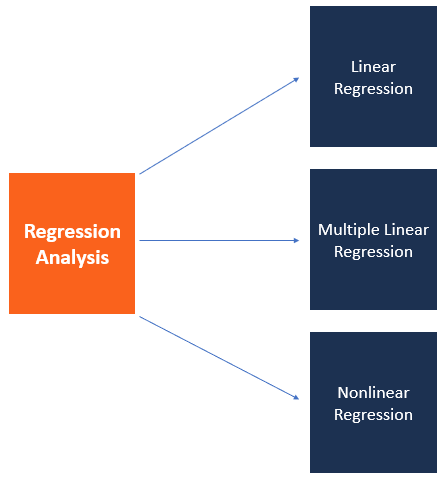
Regression analysis includes several variations, such as linear, multiple linear, and nonlinear. The most common models are simple linear and multiple linear. Nonlinear regression analysis is commonly used for more complicated data sets in which the dependent and independent variables show a nonlinear relationship.
Regression analysis offers numerous applications in various disciplines, including finance.
Linear regression analysis is based on six fundamental assumptions:
Simple linear regression is a model that assesses the relationship between a dependent variable and an independent variable. The simple linear model is expressed using the following equation:
Where:
Check out the following video to learn more about simple linear regression:
Multiple linear regression analysis is essentially similar to the simple linear model, with the exception that multiple independent variables are used in the model. The mathematical representation of multiple linear regression is:
Where:
Multiple linear regression follows the same conditions as the simple linear model. However, since there are several independent variables in multiple linear analysis, there is another mandatory condition for the model:
Regression analysis comes with several applications in finance. For example, the statistical method is fundamental to the Capital Asset Pricing Model (CAPM). Essentially, the CAPM equation is a model that determines the relationship between the expected return of an asset and the market risk premium.
The analysis is also used to forecast the returns of securities, based on different factors, or to forecast the performance of a business. Learn more forecasting methods in CFI’s Budgeting and Forecasting Course!
In finance, regression analysis is used to calculate the Beta (volatility of returns relative to the overall market) for a stock. It can be done in Excel using the Slope function.
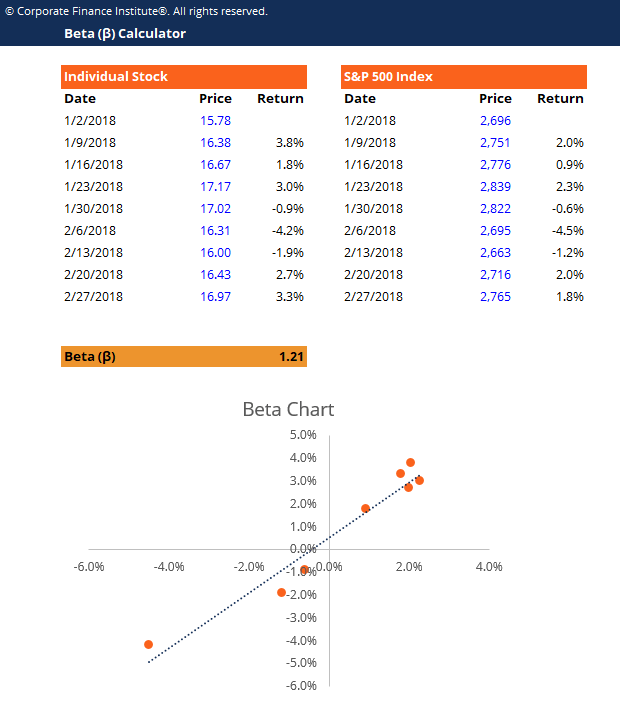
Download CFI’s free beta calculator!
When forecasting financial statements for a company, it may be useful to do a multiple regression analysis to determine how changes in certain assumptions or drivers of the business will impact revenue or expenses in the future. For example, there may be a very high correlation between the number of salespeople employed by a company, the number of stores they operate, and the revenue the business generates.
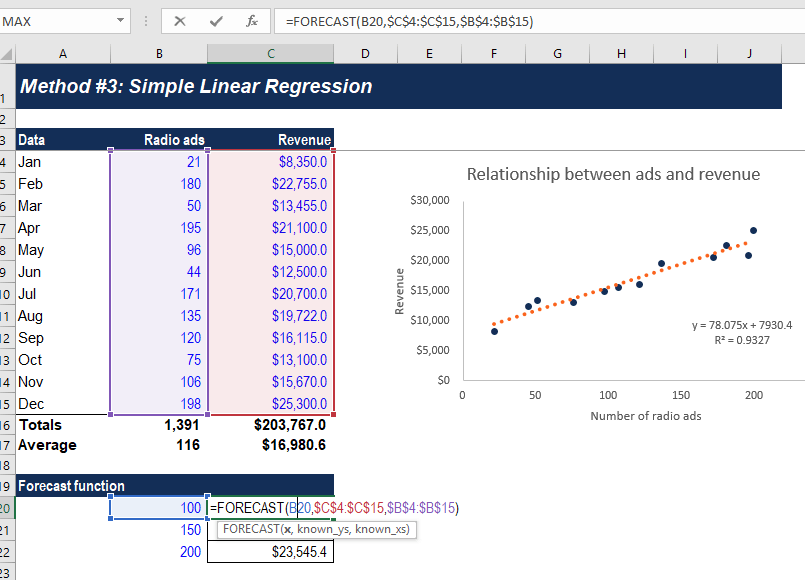
The above example shows how to use the Forecast function in Excel to calculate a company’s revenue, based on the number of ads it runs.
Learn more forecasting methods in CFI’s Budgeting and Forecasting Course!
Excel remains a popular tool to conduct basic regression analysis in finance, however, there are many more advanced statistical tools that can be used.
Python and R are both powerful coding languages that have become popular for all types of financial modeling, including regression. These techniques form a core part of data science and machine learning, where models are trained to detect these relationships in data.
Learn more about regression analysis, Python, and Machine Learning in CFI’s Business Intelligence & Data Analysis certification.
To learn more about related topics, check out the following free CFI resources:


