
Get In-Demand Finance Certifications
A historical beta adjusted to reflect the tendency of beta to be mean-reverting
Adjusted beta tends to estimate a security’s future beta. It is a historical beta adjusted to reflect the tendency of beta to be mean-reverting – the CAPM’s beta value will move towards the market average of 1 over time.
The beta estimate based purely on historical data – known as the unadjusted beta – is not a good indicator of the future. As a consequence of different choices in the time period used, interval effect, and market index, different services adjust their regression betas towards one and use the adjusted beta to calculate the expected return.
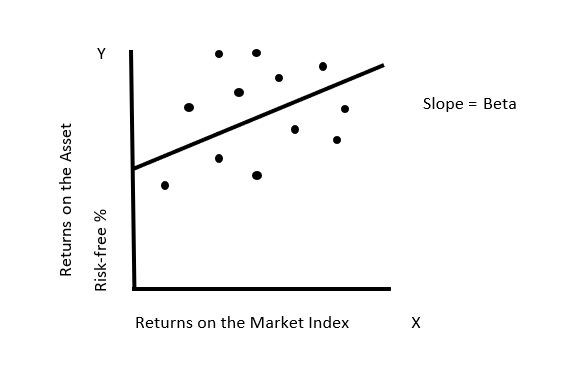
Beta measures a security’s volatility, or systematic risk, relative to the movements in the overall market. It is estimated by regressing the returns on any asset against returns on an index representing the market portfolio, over a reasonable period.
It measures the risk added on to a diversified portfolio and is centered around one. A stock that moves more than the market shows a beta more than 1.0, and a stock that moves less than the market demonstrates a beta less than 1.0. Low-beta stocks are less risky and fetch lower returns than high-beta stocks.
Beta = Covariance / Variance
The Capital Asset Pricing Model (CAPM) outlines the relationship between the expected return for assets and systematic risk – measured by the covariance of an investment’s return with the returns of the market. A positive covariance indicates that the returns move in the same direction, while a negative covariance indicates that they move inversely.
The model describes individual stock returns as a function of the overall market returns and assumes zero transaction costs. It concludes that the optimally diversified portfolio includes every traded asset in the market, and the risk of an investment is the risk added on to a diversified portfolio. The expected return is calculated as:
Expected Return = Risk-free Rate + (Beta * Market Risk Premium)
Important Observations:
Return of the Asset = Average Market Return
In actual practice, there are no indices that come close to the market portfolio. Instead, the equity market indices and fixed income market indices include only a subset of the securities in each market and are not comprehensive.
The S&P 500 – the most widely used index for beta estimation for US companies – includes only 500 of the thousands of equities that are traded in the US market. The indices used in emerging markets include very few companies and tend to be even narrower.
The choice of return interval also affects beta estimates. The theory does not state whether returns should be measured daily, weekly, monthly, quarterly, or annually. The beta coefficient of the security varies across return frequencies. The phenomenon is referred to as the intervalling effect bias in beta.
Assets are not traded on a continuous basis, and as a result of such a non-trading problem, the beta estimate can be affected – non-trading during a return period can reduce the measured correlation with the market index.
Betas calculated during shorter intervals are likely to show a significant bias due to the non-trading problem. Illiquid companies report lower beta than they ideally should assume, and liquid companies report higher beta than is justified.
Risk-return models are silent on the time period one needs to use to estimate betas. While selecting a time period for beta estimation, one must be careful of the trade-off involved. By going back further in time, although there’s an advantage of including more observations in the regression, it can be offset by the fact that the company itself might’ve changed in terms of its business mix, characteristics, and leverage, over time.
The Blume Technique was proposed by Marshall E. Blume, who was the Howard Butcher Professor of Finance at the University of Pennsylvania, in 1975 in his paper “Betas and Their Regression Tendencies.” According to Blume, there is a tendency of betas to converge towards the mean of all betas. He describes the tendency by correcting historical betas to adjust the beta to revert to 1, assuming that the adjustment in one period is a good estimate in the next period.
Consider betas for all stocks j in period 1, βj1, and betas for the same stocks j in the successive period 2, βj2. Further, the betas in period 2 are regressed against the betas for period 1 to obtain the following equation:
βj2 = b0 + b1βj1
Vasicek (1973) adjusted past betas towards the average beta by modifying each beta depending on the sampling error of the beta. If β1 is the average beta across the sample of stocks in the historical period, then the Vasicek technique involves taking a weighted average of β1 and the historical beta for security j.
Bloomberg Estimate
Adjusted Beta = Regression Beta (0.67) + 1.00 (0.33)
Research suggests that, over time, there is a general tendency for betas of all companies to converge towards one. Intuitively, it should not be surprising. Because most companies tend to grow in size, become more diversified, and own more assets, over time, their beta values fluctuate less, resulting in beta mean reversion.
Connect what you just learned to a clear career path with CFI’s role‑based courses and certification programs.
Thank you for reading CFI’s guide to Adjusted Beta. To keep learning and developing your knowledge of financial analysis, we highly recommend the additional resources below:


