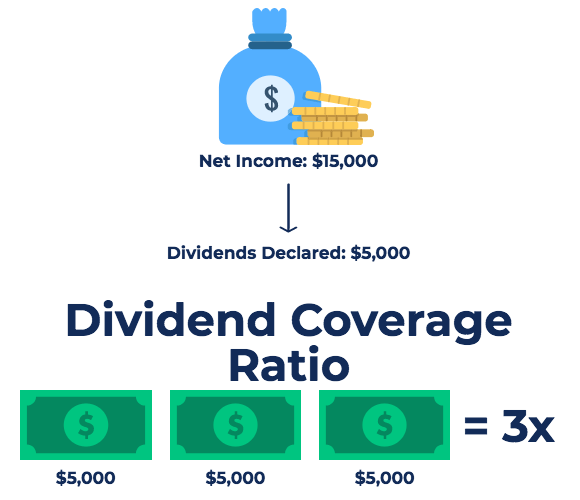
The Dividend Coverage Ratio, also known as dividend cover, is a financial metric that measures the number of times that a company can pay dividends to its shareholders. The dividend coverage ratio is the ratio of the company’s net income divided by the dividend paid to shareholders.
Dividend Coverage Ratio Formula
The general formula for calculating DCR is as follows:
Dividend Coverage Ratio = Net income / Dividend declared
Where:
Net income is the earnings after all expenses, including taxes, are paid
Dividend declared is the amount of dividend entitled to shareholders
There are also some modified versions of the dividend coverage ratio, which will be discussed below.
The first variation is used to determine the number of times a company can pay dividends to common shareholders when the company also has preferred shares to take into consideration.
The formula is:
DCR = (Net income – Required preferred dividend payments) / Dividends declared to common shareholders
This variation can also be used to determine the number of times a company can pay dividends to preferred shareholders:
The formula is:
DCR = Net income / Dividends declared to preferred shareholders
Example of Dividend Coverage Ratio
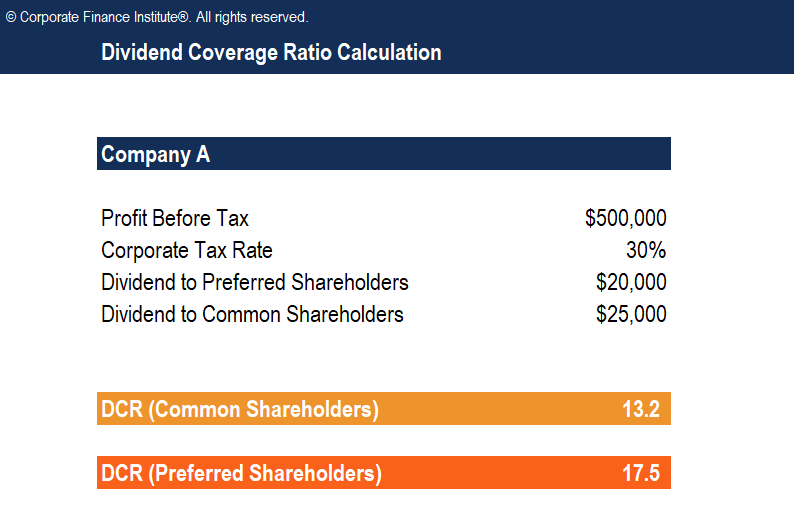
Let’s consider the following example. Company A reported the following figures:
Profit before tax: $500,000
Corporate tax rate: 30%
Dividend to preferred shareholders: $20,000
Dividend to common shareholders: $25,000
Determine the dividend coverage ratio for preferred and common shareholders:
Enter your name and email in the form below and download the free template now!
Dividend Coverage Ratio Template
Download the free Excel template now to advance your finance knowledge!
Interpretation of Dividend Coverage Ratio
If the dividend coverage ratio is greater than 1, it indicates that the earnings generated by the company are enough to serve shareholders with their dividends. As a rule of thumb, a DCR above 2 is considered good. A deteriorating DCR or a dividend cover that is consistently below 1.5 may be a cause for concern for shareholders. A consistently low or a deteriorating dividend cover may signal poor company profitability in the future, which may mean the company will be unable to sustain its current level of dividend payouts.
Issues with the Dividend Coverage Ratio
Although DCR is a useful indicator of dividend payment risk to shareholders, there are a couple of key issues with the ratio for investors to consider:
Net income is not actual cash flow
In calculating a company’s DCR, we use net income in the numerator. Net income does not necessarily equal cash flow. Therefore, a company may report a fairly high net income but still not actually have the cash available to make dividend payments.
It’s a poor indicator of future risk
Net income can change dramatically from one year to the next. Therefore, calculating a high DCR based on past historical performance may not be a reliable predictor of dividend risk in future years.
Nonetheless, the dividend cover is still commonly used by investors and market analysts to estimate the level of risk associated with receiving dividends from an investment.
Key Takeaways from Dividend Coverage Ratio
In summary, the key points to know about the DCR are:
The dividend coverage ratio measures the number of times a company can pay its current level of dividends to shareholders.
A DCR above 2 is considered a healthy ratio.
A DCR below 1.5 may be a cause for concern.
The DCR uses net income, which is not actual cash flow. Therefore, even a high net income does not guarantee adequate cash flows to fund dividend payments.
The DCR is a fairly poor indicator of future risk. Net income can vary greatly from year to year, so looking at a company’s historical DCR is not a definitive measure of future dividend risk.
Additional Resources
Thank you for reading CFI’s guide to Dividend Coverage Ratio. To help you advance your career in the financial services industry, check out the following additional CFI resources:
Take your learning and productivity to the next level with our Premium Templates.
Upgrading to a paid membership gives you access to our extensive collection of plug-and-play Templates designed to power your performance—as well as CFI's full course catalog and accredited Certification Programs.
Gain unlimited access to more than 250 productivity Templates, CFI's full course catalog and accredited Certification Programs, hundreds of resources, expert reviews and support, the chance to work with real-world finance and research tools, and more.