Get Certified for Financial Modeling (FMVA)®
Gain in-demand industry knowledge and hands-on practice that will help you stand out from the competition and become a world-class financial analyst.
Download our free Investment Banking Pitchbook Template
By analyzing a company’s historical share price performance, we can visualize the catalysts that have moved its valuation over time, and recommend transactions that will be perceived positively by the market. This article will cover some key valuation drivers and provide different methods of visualizing share prices in a pitchbook.
Share prices, at their highest levels, are the market’s aggregated expectations of future cash flows for any given company. In corporate finance theory, we know that a firm’s value is the sum of these future cash flows. Ultimately, the strategies and tactics employed by a company will affect its expected future cash flows and depending on how their actions are perceived by the market, its share price will reflect changes in these expectations.
Download CFI’s customizable pitchbook template to create your own professional presentation.
By far, the most common driver of stock prices is periodic earnings releases from the company. Equity research analysts will author reports with their estimates of earnings per share, and the average of these estimates form what we know as the “consensus estimate.” The difference between actual reported earnings and the consensus estimate will invariably impact the stock’s value. A key function of an investment banker is to provide explanations for why the company either beat or missed consensus and which strategies a company can employ to sustain a positive track record moving forward.
In capital budgeting theory, if a company pursues an NPV positive project, the company’s stock price should increase by the present value of the sum of future cash flows (NPV) divided by the number of shares outstanding. Extending this logic, an M&A transaction should work via the same mechanism. The transaction value is the initial capital investment, the future cash flows of the target company should be the NPV, and if new shares were issued to finance the acquisition, the new shares outstanding is the divisor used to find the marginal impact on the share price. In practice, however, the actual impact on the stock price can vary significantly depending on other critical qualitative aspects of a transaction.
The above reasons are some examples of public market events, and if the market was perfectly efficient and rational, the share price ought to stay flat between announcement dates. However, looking at a company’s historical share price performance, we will observe that prices fluctuate daily due to capital flows from investors. For example, if an investor of a small company whose shares are illiquid decides to place a block sell order, the price of the stock may be driven down as his order is filled. Another driver of share prices is the recent emergence of ETFs and index funds that rebalance their holdings, which has been increasing in impact. For example, a small-cap ETF constituent that has recently experienced a massive increase in value may not qualify for inclusion within the same ETF if the constituent now trades at a mid-cap valuation. The rebalancing that follows can also have an impact on the share price. As an investment banker, it is important that we learn how to distinguish the material drivers of valuation from random noise.
There are numerous ways to display share price information, and the most appropriate method will depend on the type of story your bank’s directors will want to convey to company management. While every bank’s preferences and formatting conventions are unique, the following elements are some examples of industry best practices for visualizing stock prices.
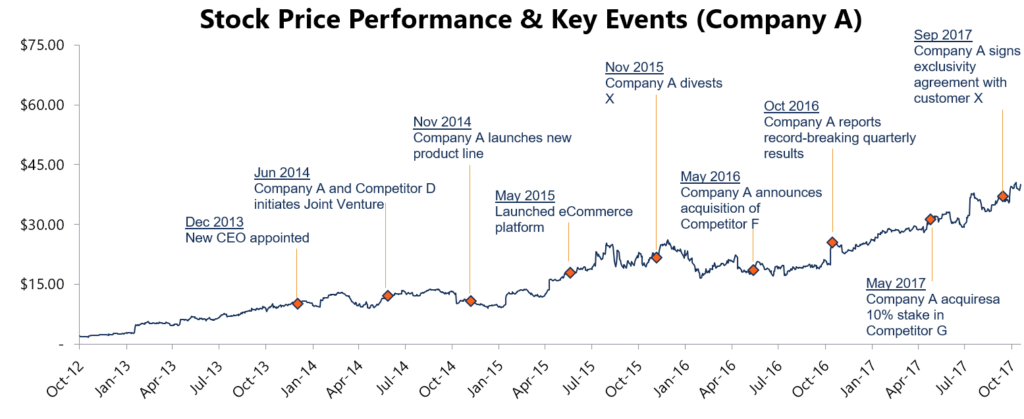
Annotating a stock price chart with major company announcements is a simple way to visualize a “highlight reel” of the company’s most impressive price movements. Strong earnings and transformative corporate finance activity are some of the key drivers that will influence a company’s valuation. The annotations included in a stock price graph should tell a story that connects management strategy and market perception.
While a company’s share valuation may have moved significantly, this information is not very useful without comparing its relative performance to some benchmark. This benchmark may be an index, such as the S&P 500, or a group of peers operating in similar industry verticals. The term “indexing” refers to the practice of setting a base period’s valuation to 100 for the comparable index/peer set and visualizing the relative performance of each ticker to the base year. This is a much more useful way to visualize changes in valuation, especially for comparing these changes across benchmarks.
Other financial or operating metrics may closely track the share price, whether they are leading or lagging in nature. For example, the traditional valuation methodology of discounted cash flows may not be applicable to an early-stage SaaS company that is not producing any cash flows. However, the company’s stock price may follow in line with other operating metrics, such as subscriber growth. Overlaying these metrics with the stock price can help focus the story that investment bankers tell, which can be quite interesting, especially if we observe divergence with a historical correlation.
Thank you for downloading CFI’s free investment banking pitchbook template. To keep learning and advancing your career, the following resources will be helpful:
Below is a break down of subject weightings in the FMVA® financial analyst program. As you can see there is a heavy focus on financial modeling, finance, Excel, business valuation, budgeting/forecasting, PowerPoint presentations, accounting and business strategy.

A well rounded financial analyst possesses all of the above skills!
CFI is the global institution behind the financial modeling and valuation analyst FMVA® Designation. CFI is on a mission to enable anyone to be a great financial analyst and have a great career path. In order to help you advance your career, CFI has compiled many resources to assist you along the path.
In order to become a great financial analyst, here are some more questions and answers for you to discover:


