Get Certified for Financial Modeling (FMVA)®
Gain in-demand industry knowledge and hands-on practice that will help you stand out from the competition and become a world-class financial analyst.
A liquidity ratio that uses daily operational expenses
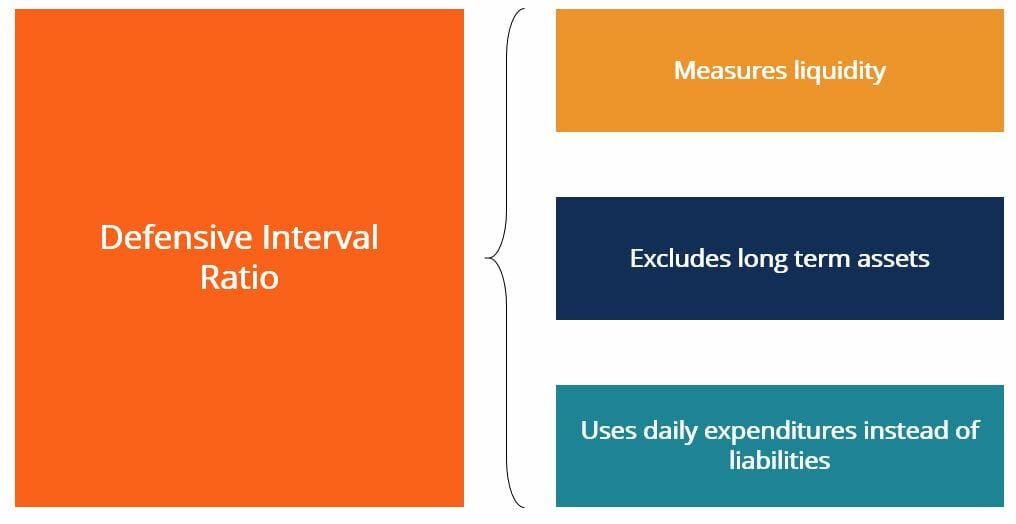
The defensive interval ratio (DIR) is a financial liquidity ratio that indicates how many days a company can operate without needing to tap into capital sources other than its current assets. It is also known as the basic defense interval ratio (BDIR) or the defensive interval period ratio (DIPR).
Sources of capital include long-term assets such as a company’s patents or PP&E investments, which have relatively poor liquidity. This means they might take considerably more time to sell off at their fair market value.
Typically, long-term assets cannot be sold in the current accounting period. They usually take upwards of one year to liquidate. Examples of long-term, less liquid capital include a company’s external sources of capital that would require time to see cash flows from (e.g., issuing new debt or equity).
A key difference between the defensive interval ratio and other ratios is that the DIR does not compare the company’s current assets to current liabilities. Rather, it compares the company’s current assets to the company’s daily cash expenditures.
As a result, many analysts believe that it is a better ratio to utilize when assessing the liquidity of a specific company. The ratio is labeled “defensive” since it incorporates the company’s current assets, which are also called defensive assets.
The defensive interval ratio is calculated by dividing the company’s current assets by its daily expenditures, as indicated below:

Where:
Current Assets = Cash + Accounts Receivable + Marketable Securities
Daily Expenditures = (Annual Operating Expenses – Non-cash Charges) / 365
Many analysts believe that the DIR is a better liquidity ratio to use than the classic quick ratio or current ratio. This is because the DIR measures a company’s short-term liquidity in regard to its daily expenditures.
Also, the DIR provides analysts with a number of days, rather than a ratio of the company’s assets to liabilities. This makes it easier to interpret as a measure of liquidity. Knowing that a company can remain liquid for “X” number of days without tapping into its long-term assets is an easily grasped point of reference.
It provides a clearer, more definitive point of information than, for example, the knowledge that a company has a quick ratio that is greater than one.
That being said, the defensive interval ratio, by itself, does not provide significant context about the company’s situation. The ratio should be compared to the DIR of comparable companies in the same industry in order to gain insight into the company’s relative performance. The DIR can also be compared to the company’s own historical DIR to see the liquidity trend over time.
Suppose that a company currently has $40,000 in cash, $10,000 in accounts receivable, and $20,000 worth of available for sale securities. The company has $300,000 in annual operating expenses and incurs $25,000 in annual depreciation. What is its defensive interval ratio?
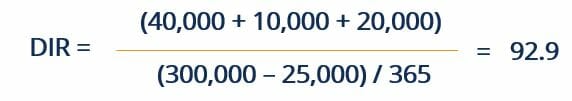
Using the equation above, we can see that this company has a DIR of 92.9 days. As always, this number does not mean much by itself and should be compared to the company’s historical DIRs and competitor DIRs in order to draw additional insights.
Thank you for reading CFI’s explanation of the defensive interval ratio. CFI offers the Financial Modeling & Valuation Analyst (FMVA)™ certification program for those looking to take their careers to the next level. To learn more about related topics, check out the following CFI resources:


