Get Certified for Financial Modeling (FMVA)®
Gain in-demand industry knowledge and hands-on practice that will help you stand out from the competition and become a world-class financial analyst.
The use of a weighted average to determine the amount that goes into COGS and inventory
In accounting, the Weighted Average Cost (WAC) method of inventory valuation uses a weighted average to determine the amount that goes into COGS and inventory. The weighted average cost method divides the cost of goods available for sale by the number of units available for sale. The WAC method is permitted under both GAAP and IFRS accounting.
The formula for the weighted average cost method is as follows:

Where:
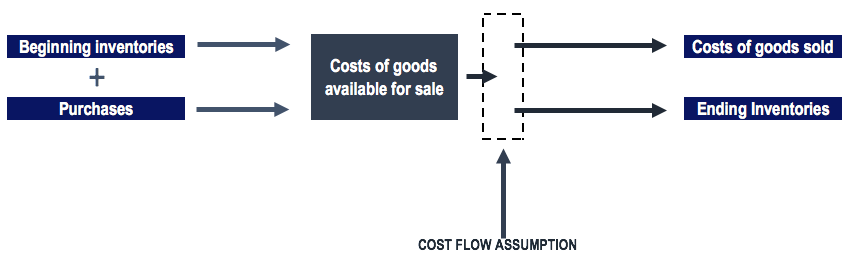
The bundling of costs is referred to as the cost of goods available for sale. The costs of goods available for sale are either allocated to COGS or ending inventory. Allocating the costs of goods available for sale is referred to as a cost flow assumption. There are several cost flow assumptions, such as:
Using the weighted average cost method yields different allocation of inventory costs under a periodic and perpetual inventory system.
In a periodic inventory system, the company does an ending inventory count and applies product costs to determine the ending inventory cost. COGS can then be determined by combining the ending inventory cost, beginning inventory cost, and the purchases throughout the period.
A perpetual inventory system keeps continual tracking of inventories and COGS. The perpetual inventory system provides more timely information for the management of inventory levels. However, this method of inventory tracking can be costly for a company. In a perpetual inventory system, the weighted average cost method is referred to as the “moving average cost method.”
Below, we will use the weighted average cost method and identify the difference in the allocation of inventory costs under a periodic and perpetual inventory system.
At the beginning of its January 1 fiscal year, a company reported a beginning inventory of 300 units at a cost of $100 per unit. Over the first quarter, the company made the following purchases:
In addition, the company made the following sales:
Under the periodic inventory system, we would determine the cost of goods available for sale and the units available for sale at the end of the first quarter:
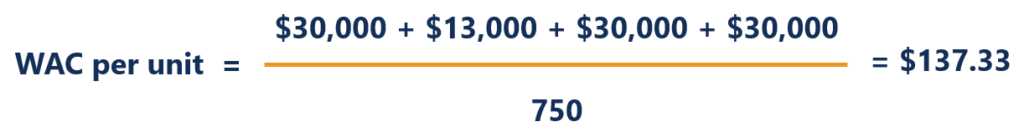
For the sale of 170 units over the January-March period, we would allocate $137.33 per unit sold. The rest would go into ending inventory. Therefore:
Note: The numbers may be slightly off due to rounding off.

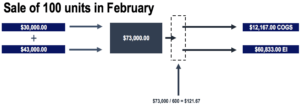
Under the perpetual inventory system, we would determine the average before the sale of units.
Therefore, before the sale of 100 units in February, our average would be:
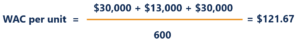
For the sale of 100 units in February, the costs would be allocated as follows:
Note: The numbers may be slightly off due to rounding off.
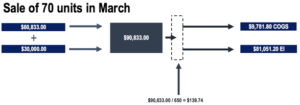
Before the sale of 70 units in March, our average would be:
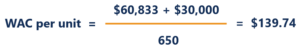
For the sale of 70 units in March, the costs would be allocated as follows:
Note: The numbers may be slightly off due to rounding off.
The diagrams would look as follows under the perpetual inventory system:
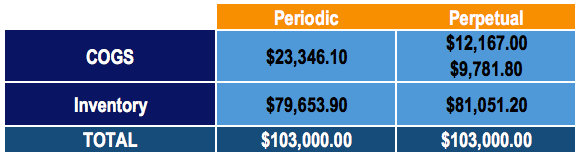
Comparing the costs allocated to COGS and inventory, we can see that the costs are allocated differently depending on whether it is a periodic or perpetual inventory system. However, notice that the total costs remain the same (as they should).
In our example, the inventories purchased experienced a price appreciation. January purchase costs per unit were $130, February purchase costs per unit were $150, and March purchase costs per unit were $200. Therefore, since the periodic system uses the costs of goods available for sale over the entire quarter, more is allocated to the costs of goods sold for the sale of inventory.
Connect what you just learned to a clear career path with CFI’s role‑based courses and certification programs.
Thank you for reading CFI’s guide to Weighted Average Cost. To keep learning and advance your career, the following CFI resources will be helpful:


