Over 2 million + professionals use CFI to learn accounting, financial analysis, modeling and more. Unlock the essentials of corporate finance with our free resources and get an exclusive sneak peek at the first module of each course.
Start Free
What is Range?
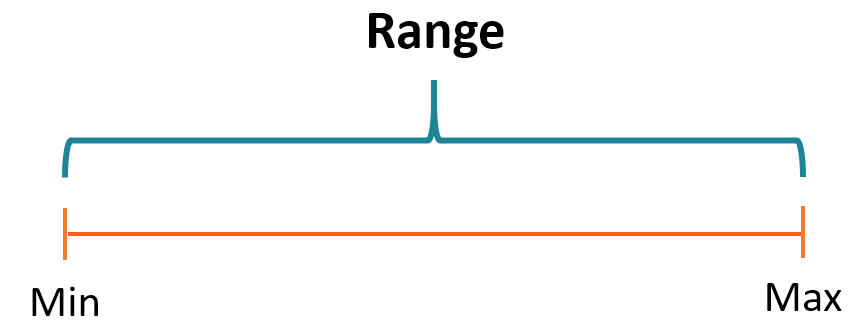
In statistics and mathematics, range is the difference between the largest and smallest values in a dataset. The range is one of the measures of dispersion of data.
Range in Finance
In finance, the range is defined as a difference between the low and high prices of a security over a certain period of time. This statistical measure is primarily used by traders in their technical analysis (also known as a trading range). The well-established high and low prices in the trading range are considered resistance (high price) and support (low price) levels. In addition, the range is almost always specified in equity reports.
Range is also used as a measure of the volatility of a security. The size of the range corresponds to the security’s level of risk. Generally, safe securities such as fixed-income instruments (e.g., government bonds) tend to show a smaller range of prices while the riskier types of securities such as equities demonstrate larger ranges.
The range of a security’s prices may be affected by several factors, including fundamental variables, as well as macroeconomic factors.
Although range may provide a simple and insightful opportunity to assess the risk associated with a particular security, you should not rely on it solely. The statistical measure may be misleading if your dataset (e.g., the security’s prices for a specific period) contains outliers. The large outliers may increase the range without reflecting the true dispersion of the dataset.
How to Calculate Range?
Unlike other measures of dispersion such as standard deviation that requires tedious calculations, the range can be calculated easily. In order to find the range in a dataset, you do the following:
In the given dataset, find the minimum and maximum values.
Calculate the difference between the maximum and minimum values.
Range = Max – Min
In finance, the range can be found using the formula above. However, in financial analysis, you do not always want the range of the security’s prices for all the available periods. Instead, a certain period of time is specified (week, month, year, etc.).
Example of Range
You are an equity trader at a bank. Currently, you are planning to execute a new transaction using the stock of ABC Corp., which trades at $14 per share. You want to determine the trading range of the stock to identify the best transaction price for the trade.
By analyzing the prices of the stock over the last year, you’ve found out that the highest stock price reached was $17 per share while the lowest price was $8 per share. Thus, the range of ABC Corp.’s stock prices is:
Range = $17 – $8 = $9
In order to reap profits from the trade, you may want to wait until the share price comes close to the top margin of the trading range ($17) and short-sell the stocks, or wait till it nears the bottom of the range and buy the stock.
Take your learning and productivity to the next level with our Premium Templates.
Upgrading to a paid membership gives you access to our extensive collection of plug-and-play Templates designed to power your performance—as well as CFI's full course catalog and accredited Certification Programs.
Gain unlimited access to more than 250 productivity Templates, CFI's full course catalog and accredited Certification Programs, hundreds of resources, expert reviews and support, the chance to work with real-world finance and research tools, and more.