Get Certified for Financial Modeling (FMVA)®
Gain in-demand industry knowledge and hands-on practice that will help you stand out from the competition and become a world-class financial analyst.
Evaluating a company's debt coverage ability
The cash flow to debt ratio is a coverage ratio that compares the cash flow that a business generates to its total debt. The cash flow most commonly used to calculate the ratio is the cash flow from operations, although using unlevered free cash flow is also a viable option.
Some businesses may opt to use their EBITDA number in the calculation. However, this is not recommended, since EBITDA takes into account new inventory purchases that may take a long time to be sold and generate cash flow.

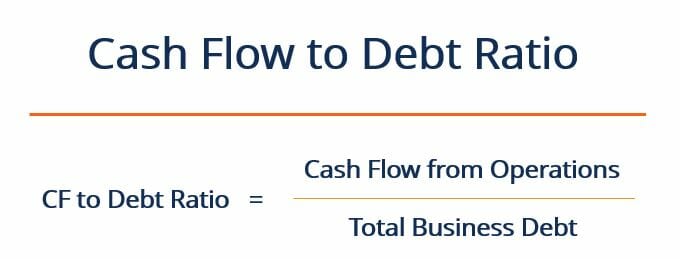
The ratio is calculated by dividing the business’ cash flow from operations by its total debt:
The cash flow to debt ratio is expressed as a percentage, but can also be expressed in years by dividing 1 by the ratio. This would tell us how many years it would take the business to pay off all of its debt if it were to devote all cash flow generated from operations to repaying debt.
For example, if a company’s ratio is 20%, then it could, theoretically, pay off all its outstanding debt in five years.
1 divided by 0.2 = 5
Another way of thinking about the cash flow to debt ratio is that it shows how much of a business’ debt could be paid off in one year if all cash flows were devoted to debt repayment. In this example, the answer would be 20%. However, practically speaking, it’s unrealistic to envision a business dedicating 100% of its operational cash to debt repayment.
Assume a company has total debts equal to $1.5 million. Its cash flow from operations in the past year was $350,000. The company’s cash flow to debt ratio would be calculated as follows:
$350,000 ÷ $1,500,000 = 0.23 or 23%
A ratio of 23% indicates that it would take the company between four and five years to pay off all its debt, assuming constant cash flows for the next five years.
A high cash flow to debt ratio indicates that the business is in a strong financial position and is able to accelerate its debt repayments if necessary. Conversely, a low ratio means the business may be at a greater risk of not making its interest payments, and is on a comparably weaker financial footing.
To define what a “high” or “low” ratio is, we must compare it to the ratio of other companies in the same industry. The ratio can also be looked at historically for a business, indicating how its debt coverage ability has changed over the course of time.
In the calculation of the cash flow to debt ratio, analysts do not typically use the cash flow from financing or cash flow from investing. If the business has a highly leveraged capital structure, it is likely that the business has a fair amount of debt to pay off. It would not make sense to assume that the business was paying off its debt using its debt capital. Therefore, the cash flow from financing is not used in the calculation.
Cash flow from investing activities is also not commonly used in the calculation of the ratio since investing activities are not part of the business’ core cash-generating activities. It is thought better to use a cash flow number that is more representative of the business’ day-to-day activities. Two good options are cash flow from operations or unlevered free cash flow.
CFI offers the Financial Modeling & Valuation Analyst (FMVA)™ certification program for those looking to take their careers to the next level. To learn more about related topics, check out the following CFI resources:
Below is a break down of subject weightings in the FMVA® financial analyst program. As you can see there is a heavy focus on financial modeling, finance, Excel, business valuation, budgeting/forecasting, PowerPoint presentations, accounting and business strategy.

A well rounded financial analyst possesses all of the above skills!
CFI is the global institution behind the financial modeling and valuation analyst FMVA® Designation. CFI is on a mission to enable anyone to be a great financial analyst and have a great career path. In order to help you advance your career, CFI has compiled many resources to assist you along the path.
In order to become a great financial analyst, here are some more questions and answers for you to discover:


