The Debt to Equity ratio (also called the “debt-equity ratio”, “risk ratio”, or “gearing”), is a leverage ratioLeverage RatiosA leverage ratio indicates the level of debt incurred by a business entity against several other accounts in its balance sheet, income statement, or cash flow statement. Excel template that calculates the weight of total debt and financial liabilities against total shareholders’ equityStockholders EquityStockholders Equity (also known as Shareholders Equity) is an account on a company's balance sheet that consists of share capital plus. Unlike the debt-assets ratio which uses total assets as a denominator, the D/E Ratio uses total equity. This ratio highlights how a company’s capital structureCapital StructureCapital structure refers to the amount of debt and/or equity employed by a firm to fund its operations and finance its assets. A firm's capital structure is tilted either toward debt or equity financing.
Debt to Equity Ratio Formula
Short formula:
Debt to Equity Ratio = Total Debt / Shareholders’ Equity
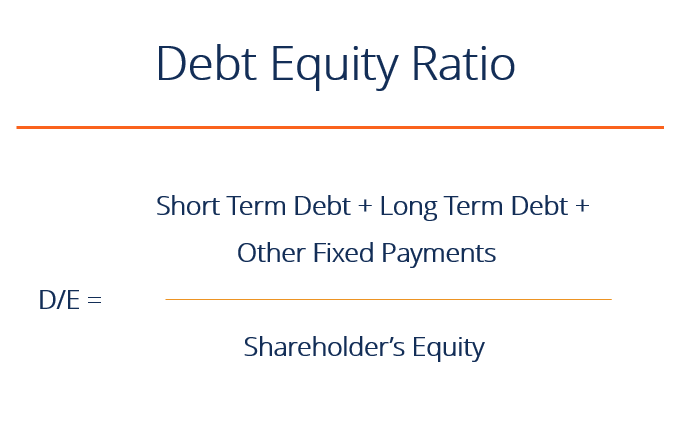
Long formula:
Debt to Equity Ratio = (short term debt + long term debt + fixed payment obligations) / Shareholders’ Equity
Debt to Equity Ratio in Practice
If, as per the balance sheetBalance SheetThe balance sheet is one of the three fundamental financial statements. These statements are key to both financial modeling and accounting, the total debt of a business is worth $50 million and the total equity is worth $120 million, then debt-to-equity is 0.42. This means that for every dollar in equity, the firm has 42 cents in leverage. A ratio of 1 would imply that creditors and investors are on equal footing in the company’s assets.
A higher debt-equity ratio indicates a levered firmDegree of Financial LeverageThe degree of financial leverage is a financial ratio that measures the sensitivity in fluctuations of a company’s overall profitability to the volatility of its operating income caused by changes in its capital structure. The degree of financial leverage is one of the methods used to quantify a company’s financial risk, which is quite preferable for a company that is stable with significant cash flowThe Ultimate Cash Flow Guide (EBITDA, CF, FCF, FCFE, FCFF)This is the ultimate Cash Flow Guide to understand the differences between EBITDA, Cash Flow from Operations (CF), Free Cash Flow (FCF), Unlevered Free Cash Flow or Free Cash Flow to Firm (FCFF). Learn the formula to calculate each and derive them from an income statement, balance sheet or statement of cash flows generation, but not preferable when a company is in decline. Conversely, a lower ratio indicates a firm less levered and closer to being fully equity financed. The appropriate debt to equity ratio varies by industry.
A company’s total debt is the sum of short-term debt, long-term debtLong Term DebtLong Term Debt (LTD) is any amount of outstanding debt a company holds that has a maturity of 12 months or longer. It is classified as a non-current liability on the company’s balance sheet. The time to maturity for LTD can range anywhere from 12 months to 30+ years and the types of debt can include bonds, mortgages, and other fixed payment obligations (such as capital leases) of a business that are incurred while under normal operating cycles. Creating a debt scheduleDebt ScheduleA debt schedule lays out all of the debt a business has in a schedule based on its maturity and interest rate. In financial modeling, interest expense flows helps split out liabilities by specific pieces.
Not all current and non-current liabilities are considered debt. Below are some examples of things that are and are not considered debt.
Considered debt:
Drawn line-of-creditRevolving Credit FacilityA revolving credit facility is a line of credit that is arranged between a bank and a business. It comes with an established maximum amount, and the
Notes payable (maturity within a year)
Current portion of Long-Term DebtCurrent Portion of Long-Term DebtThe current portion of long-term debt is the portion of long-term debt due that is due within a year’s time. Long-term debt has a maturity of
Notes payableNotes PayableNotes payable are written agreements (promissory notes) in which one party agrees to pay the other party a certain amount of cash. (maturity more than a year)
Bonds payable
Long-Term DebtLong Term DebtLong Term Debt (LTD) is any amount of outstanding debt a company holds that has a maturity of 12 months or longer. It is classified as a non-current liability on the company’s balance sheet. The time to maturity for LTD can range anywhere from 12 months to 30+ years and the types of debt can include bonds, mortgages
Capital lease obligations
Not considered debt:
Accounts payableAccounts PayableAccounts payable is a liability incurred when an organization receives goods or services from its suppliers on credit. Accounts payables are
Accrued expensesAccrued ExpensesAccrued expenses are expenses that are recognized even though cash has not been paid. These expenses are usually paired up against revenue via the the matching principle from GAAP (Generally Accepted Accounting Principles).
Deferred revenuesDeferred RevenueDeferred revenue is generated when a company receives payment for goods and/or services that it has not yet earned. In accrual accounting,
Dividends payable
Benefits of a High D/E Ratio
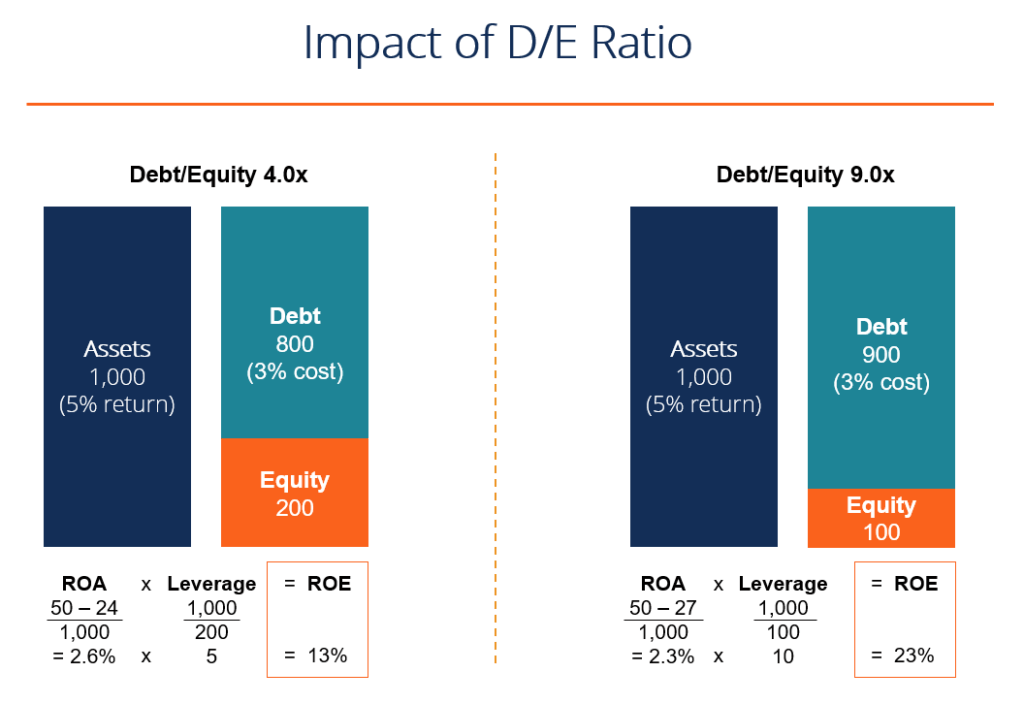
A high debt-equity ratio can be good because it shows that a firm can easily service its debt obligations (through cash flow) and is using the leverage to increase equity returns.
In the example below, we see how using more debt (increasing the debt-equity ratio) increases the company’s return on equity (ROE)Return on Equity (ROE)Return on Equity (ROE) is a measure of a company’s profitability that takes a company’s annual return (net income) divided by the value of its total shareholders' equity (i.e. 12%). ROE combines the income statement and the balance sheet as the net income or profit is compared to the shareholders’ equity.. By using debt instead of equity, the equity account is smaller and therefore, return on equity is higher.
Another benefit is that typically the cost of debt is lower than the cost of equityCost of EquityCost of Equity is the rate of return a shareholder requires for investing in a business. The rate of return required is based on the level of risk associated with the investment, and therefore increasing the D/E ratio (up to a certain point) can lower a firm’s weighted average cost of capital (WACC)WACCWACC is a firm’s Weighted Average Cost of Capital and represents its blended cost of capital including equity and debt..
The opposite of the above example applies if a company has a D/E ratio that’s too high. In this case, any losses will be compounded down and the company may not be able to service its debt.
If the debt to equity ratio gets too high, the cost of borrowingCost of DebtThe cost of debt is the return that a company provides to its debtholders and creditors. Cost of debt is used in WACC calculations for valuation analysis. will skyrocket, as will the cost of equity, and the company’s WACCWACCWACC is a firm’s Weighted Average Cost of Capital and represents its blended cost of capital including equity and debt. will get extremely high, driving down its share price.
Debt to Equity Ratio Calculator
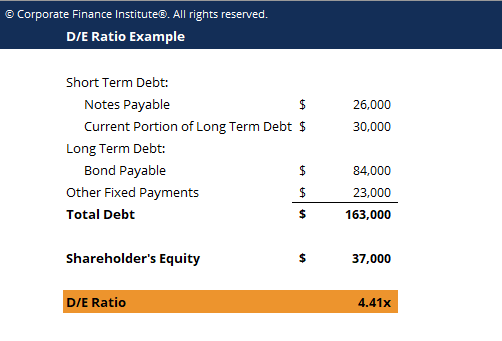
Below is a simple example of an Excel calculator to download and see how the number works on your own.
Download the Free Template
Enter your name and email in the form below and download the free template now!
Video Explanation of the Debt to Equity Ratio
Below is a short video tutorial that explains how leverage impacts a company and how to calculate the debt/equity ratio with an example.
CFI is the official provider of the Financial Modeling and Valuation Analyst (FMVA)® designationFMVA® CertificationJoin 850,000+ students who work for companies like Amazon, J.P. Morgan, and Ferrari designed to transform anyone into a world-class financial analyst.
To keep learning and developing your knowledge of financial analysis we highly recommend these additional CFI resources:
Analysis of Financial StatementsAnalysis of Financial StatementsHow to perform Analysis of Financial Statements. This guide will teach you to perform financial statement analysis of the income statement,
Price Earnings RatioPrice Earnings RatioThe Price Earnings Ratio (P/E Ratio) is the relationship between a company’s stock price and earnings per share. It gives investors a better sense of the value of a company. The P/E shows the expectations of the market and is the price you must pay per unit of current (or future) earnings
EV/EBITDA RatioEV/EBITDAEV/EBITDA is used in valuation to compare the value of similar businesses by evaluating their Enterprise Value (EV) to EBITDA multiple relative to an average. In this guide, we will break down the EV/EBTIDA multiple into its various components, and walk you through how to calculate it step by step
Financial Modeling GuideFree Financial Modeling GuideThis financial modeling guide covers Excel tips and best practices on assumptions, drivers, forecasting, linking the three statements, DCF analysis, more
Financial Analyst Training
Get world-class financial training with CFI’s online certified financial analyst training programFMVA® CertificationJoin 850,000+ students who work for companies like Amazon, J.P. Morgan, and Ferrari !
Gain the confidence you need to move up the ladder in a high powered corporate finance career path.