Get Certified for
Capital Markets (CMSA®)
From equities and fixed income to derivatives, the CMSA certification bridges the gap from where you are now to where you want to be — a world-class capital markets analyst.
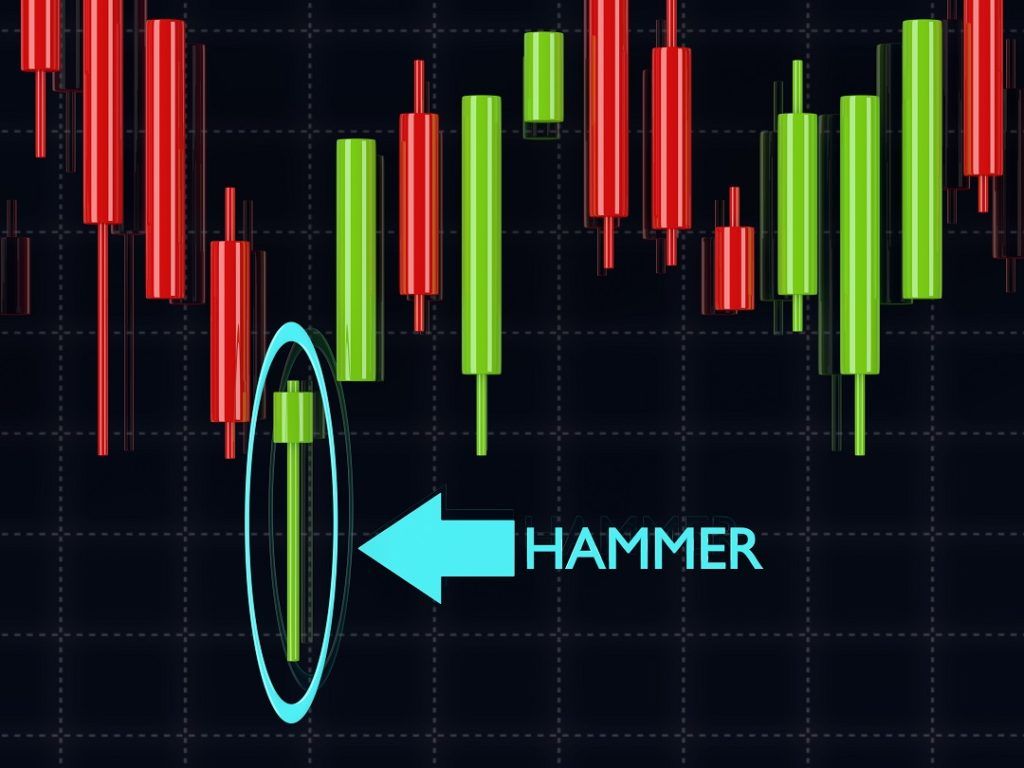
A candlestick formation that is indicates a potential impending bullish (upside) reversal
A hammer candlestick is a candlestick formation that is used by technical analysts as an indicator of a potential impending bullish (upside) reversal in the trading of a financial security.
The hammer pattern is seen as one of the most reliable indicators in candlestick charting, especially when it occurs after a protracted downtrend and in an area of recognized price support for a security. Following the formation of a hammer candlestick, many bullish traders may enter the market, whereas traders holding short-sell positions may look to close out their positions.
Several candlestick patterns are utilized by traders and market analysts as indicators of potential market reversals. In addition to the hammer candlestick formation, other candlestick charting market reversal signals include the hanging man candlestick and the shooting star candlestick.
The hammer candlestick formation is one of the easiest candlestick formations to identify, thanks to its very distinctive appearance. The key features of a hammer candlestick include:
The basic interpretation of a hammer candlestick is that it shows a trading period during which sellers pushed the price significantly lower; however, buying pressure eventually controlled the final price action during the period. The fact that the high price of the period and the closing price of the period are identical – or very close to being identical – and that both are far removed from the low price of the period is interpreted as showing that strong buying momentum was present during the close of the trading period.
In addition to the basic identifying features of the hammer candlestick – as outlined above – there are several additional characteristics which, if present, are considered by traders and analysts as making the hammer a stronger indication of a possible pending upside reversal.
The first is the relation of the closing price to the opening price. When the closing price is above the opening price, which also means that the closing price is nearer the high price of the period, it is generally interpreted as making the hammer candlestick a stronger, more reliable, technical indicator.
The hammer candlestick’s strength as a bullish reversal indicator is also increased with the length of the lower candlestick shadow. For example, if the lower shadow is three to four times longer than the candlestick body, then the hammer is considered a stronger indicator than it would be if the shadow were only twice the length of the candlestick body. It is because a longer lower shadow is interpreted as showing a more forceful and definitive rejection of lower prices.
The hammer candlestick is also considered more reliable when it forms at a price level that’s been shown as an area of technical support by previous price movement.
Keep Learning
CFI offers the Capital Markets & Securities Analyst (CMSA®) certification program for those looking to take their careers to the next level. To keep learning and developing your knowledge base, please explore the additional relevant resources below:


