Get Certified for
Capital Markets (CMSA®)
From equities and fixed income to derivatives, the CMSA certification bridges the gap from where you are now to where you want to be — a world-class capital markets analyst.
Download CFI's free option profit/loss graph maker
This option profit/loss graph maker lets the user create option strategy graphs on Excel. Up to ten different options, as well as the underlying asset can be combined. As well as manually being able to enter information, a number of pre-loaded option strategies are included in this workbook. To use these pre-loaded buttons, macros must be enabled.
Enter your name and email in the form below and download the free template now! Please note that this template uses Excel VBA Macros. You will need to enable VBA Macros for the template to work.
Below is a brief preview of CFI’s option profit/loss graph maker:
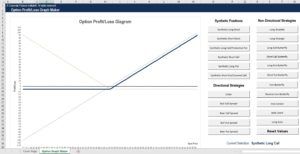
The above image shows a synthetic call option, one of the pre-loaded trading positions in this workbook. To the right of the graph, any of the buttons can be selected to preview an example of the option strategy.
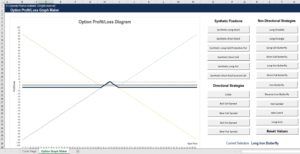
The solid dark blue line on the graph shows the profit/loss of the combined positions. The dotted lines show the profit/loss of the options and underlying asset. Below is an example of an iron butterfly spread. Using this option profit/loss graph maker, you can really visualize why the iron butterfly spread has its name.
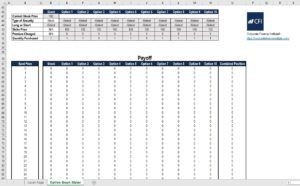
The “Reset Values” button will clear any values being shown in the graph. From there, the user can also manually input values into the table below the graph. Alternatively, an option strategy can be selected from the list of buttons as a starting point and the values in the table can be altered to suit the user’s needs. The greyed boxes represent variables the user can input information into:
This option profit/loss graph maker allows the user to:
The trading strategies that come pre-loaded into this workbook include:
Synthetic positions are portfolios that hold multiple securities that when taken together, emulate another position. These positions are usually created to alter an existing trading position. Synthetic positions can also help traders reduce transactions necessary to change a position or to identify potential mispricings in the market.
A synthetic long stock is created with a long position on the call option and a short position on the put option. This trading position can be created to emulate the corresponding asset, however, it will involve lower initial capital requirements.
A synthetic short stock is created with a short position on the call option and a long position on the put option. This trading position can be created to emulate a short position on the underlying asset. The benefit, like the synthetic long stock, are lower initial capital requirements. There is also the benefit of not needing to consider dividends like in the actual short-selling position of the stock.
The synthetic long call is created by holding a long position on the asset and a long position on the put option. This trading position emulates a long call option. Often this position is created when a trader is already holding either the asset or the put option. If they are holding the asset and believe that prices may fall, they can buy the put option hence the alternative name protective put. If a trader is holding the put option because they thought prices would fall, but expectations change, instead of selling the put they might purchase the asset, which creates the synthetic long call and lowers transaction costs.
A synthetic short call is created through a short position on the underlying asset, and a short position on the put option. This trading position emulates a short call position. Often this position is created to alter an existing one to reduce transaction costs. For example, if a trader wants to change their position from a short put to a short call, they can simply short the underlying asset rather than closing the put position and opening the call position.
A synthetic long put position is created by holding a short position on the underlying asset and a long position on the call option. This trading position emulates a long put position. Again, a synthetic long put is often created to alter an existing position. If a trader is holding a long call position and wants to switch to a long put, they can simply short the underlying asset. This is preferable to closing the call option and buying a put since it reduces the number of transactions, which in turn reduces costs.
A synthetic short put position is created by holding the underlying asset and shorting the call option. This trading position emulates a short put position. The synthetic short put can be created to alter an existing position. This position is also referred to as the covered call. Investors can sell call options to generate income, and by holding the underlying asset, they are covered if the price of the underlying asset increases and the options are exercised.
Directional trading strategies are bets on whether the underlying asset will increase or decrease in value. These strategies are used when a trader believes they can predict the direction of the market or underlying asset.
A collar is created by selling a call option, holding the underlying asset, and buying a put option. it can be thought of as a simultaneous protective put and covered call. A collar limits both the downside loss and upside gain. Collars are often used when the underlying asset has increased significantly in price and an investor holding this asset wants to protect this unrealized gain.
A bull call spread is created by holding a long position on a call option and selling a call option at a higher strike price. The investor will gain if the asset increase in price, however, the upside gain is capped by the short call option. A bull call spread is employed when an investor believes the price of the corresponding asset will increase by a limited amount. The short call option premium can be used to cover part of the cost of the long call.
The bear call spread is created by shorting a call option with a lower strike price and holding a long call with a higher strike price. This strategy is also called a credit call spread since it generates a net credit when first opened. the bear call spread is generally used to generate income if the asset price is expected to decrease or stay stable.
A bull put spread is created by buying a put option and selling a put option at a higher strike price. This option strategy is used when a trader believes the asset will move slightly higher in price. This strategy can be used to generate income and will result in a net debit when opening the position.
A bear put spread is created by selling a put option, and buying a put option at a higher strike price. This strategy is used when a trader believes that the price of the asset will fall. The gains are capped as the asset decreases in price but the losses are also capped as the asset increases in price.
Non-directional trading strategies bet on the volatility of the underlying asset. The direction the asset value moves will generally be much less important in these trading strategies. There are however exceptions that do consider the direction of the asset price in these strategies. Non-directional strategies are used when a trader believes an asset will have either very low volatility or high volatility but they do not know in which direction.
A long straddle is created by buying an at-the-money call option and an at-the-money put option. The result is a net credit and the investor will gain from a large swing in price either upwards or downwards. Traders who believe there is high volatility but do not know which direction the asset will move in may employ a straddle.
A short straddle is created by selling an at-the-money call option and at-the-money put option. This results in a net debit, however the investor has unlimited upside and downside loss potential.
A strangle is similar to a straddle. Instead of buying the call and put option at-the-money, they are both bought out-of-the-money. Since both options are out of the money, the cost of a strangle is generally less than a straddle, however, it requires greater volatility to profit from. Investors who believe there is high volatility may employ a strangle.
A short strangle is created by selling an out-of-the-money call option and out-of-the-money put option. This strategy is similar to a short straddle. It results in a net debit lower than the short straddle, however, the debit is held at a greater range for the corresponding asset price.
A long call butterfly is created by buying an in-the-money call option, selling two at-the-money call options and buying an out-of-the-money call option. This results in a net debit when opening this position. As the asset price moves in either direction, this position will fall in value, however, the upside and downside losses are capped. A trader will employ a butterfly spread when they believe the underlying asset will experience very little volatility.
A short call butterfly is created by selling an in-the-money call option, buying two at-the-money call options and selling an out-of-the-money call option. This results in a net credit, however, the investor will gain from upside or downside. The upside or downside gain in a short call butterfly is capped. An investor might employ this strategy if they believe the underlying asset will experience high volatility.
A long put butterfly is constructed by buying an out-of-the-money put option, selling two at-the-money put options and buying an in-the-money put option. This results in a net debit. The long put butterfly spread gives a payoff very similar to the long call butterfly, however, it is constructed with put options rather than call options. An investor will employ this strategy when they believe the underlying asset will experience very little volatility.
A short put butterfly is created by selling an out-of-the-money put option, buying two at-the-money put options, and selling an in-the-money put option. The profit/loss graph of this strategy is very similar to a short call butterfly spread, however, it is constructed with put options rather than call options.
A long iron butterfly is created by buying an out of the money put option, selling an at-the-money put option, selling an at-the-money call option, and buying an out-of-the-money call option. This strategy can also be thought of as a combination of a bear put spread and a bull call spread.
The profit/loss of this strategy is very similar to the long call butterfly and long put butterfly spread. The payoff will be highest between the lower and higher strike prices. A trader might employ an iron butterfly if they believe the underlying asset will experience very little volatility.
The reverse iron butterfly or short iron butterfly spread is created by selling an out-of-the-money put option, buying an at-the-money put option, buying an at-the-money call option, and selling an out-of-the-money call option. This will result in a very similar profit/loss graph as the short put butterfly and short call butterfly spread. The investor will start with a net credit when opening this trading position, however will benefit from the corresponding asset price moving upwards or downwards.
The iron condor strategy is constructed by buying an out-of-the-money put option, selling a slightly out-of-the-money put option with a higher strike price, selling a slightly out-of-the-money call option and buying an out-of-the-money call option with a higher strike price. The iron condor is similar to the iron butterfly, however, the initial net debit is lower.
The values in which the iron condor results in a profit is generally larger than the iron butterfly. A trader may employ an iron condor if they believe that the underlying asset will experience very low volatility. An iron condor may be employed over an iron butterfly if the trader is less sure about how stable the asset price will be.
The jade lizard is constructed by selling a put option with a lower strike price, selling a call option with a higher strike price, and buying a call option with an even higher strike price. The jade lizard attempts to take advantage of the volatility skew. This means that the out-of-the-money put should trade with a higher premium to an equidistant out-of-the-money call. The jade lizard will try to collect a premium from low volatility while also eliminating upside risk. This strategy is slightly bullish in direction since the downside risk is not eliminated.
A long guts option strategy is similar to strangle, however instead of constructing it using out-of-the-money options, it is created by buying an in-the-money call option and buying an in-the-money put option. The premiums that are paid will result in a net credit. This strategy will profit from a large swing in price upwards or downwards. Similar to the strangle, traders may employ this strategy when they believe the underlying asset will experience high volatility.
Thank you for reading CFI’s guide on Option Profit/Loss Graph Maker. To continue developing your career as a financial professional, check out the following additional CFI resources:


