Get Certified for Financial Modeling (FMVA)®
Gain in-demand industry knowledge and hands-on practice that will help you stand out from the competition and become a world-class financial analyst.
Every business faces critical decisions about where to invest capital. Companies must determine which projects will create value, generate strong financial returns, and align with long-term strategy.
Capital planning metrics help businesses evaluate these investment decisions systematically. The most widely used capital planning metrics include:
These metrics help finance professionals assess investment opportunities, prioritize projects, and allocate resources efficiently. This guide introduces each capital planning metric and how they lead to smarter capital investment decisions.

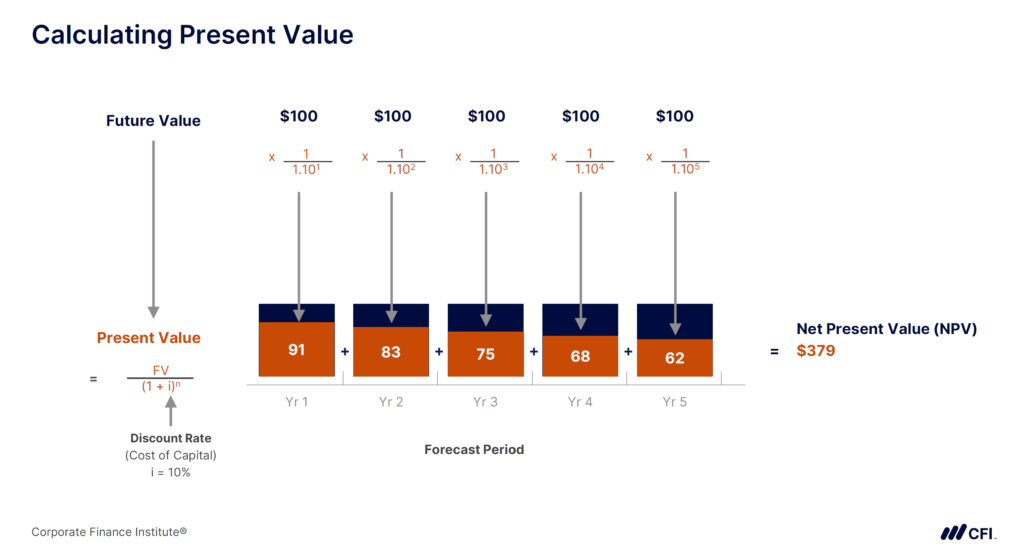
Net Present Value (NPV) measures whether an investment creates or destroys value by comparing the present value of future cash inflows to the initial investment. A positive NPV means a project is expected to add value, while a negative NPV suggests it may not be a worthwhile investment.
NPV accounts for the time value of money, making it more reliable for evaluating long-term projects and large capital investments. Businesses use NPV to compare multiple investment options, ensuring that capital is allocated efficiently.
A company is considering two projects. Both require a $1 million investment, but one has an NPV of $200,000 while the other has an NPV of -$50,000. Since NPV reflects the net value created, the company would likely choose the project with the higher NPV.
For more details on how NPV works, check out CFI’s comprehensive guide to NPV.
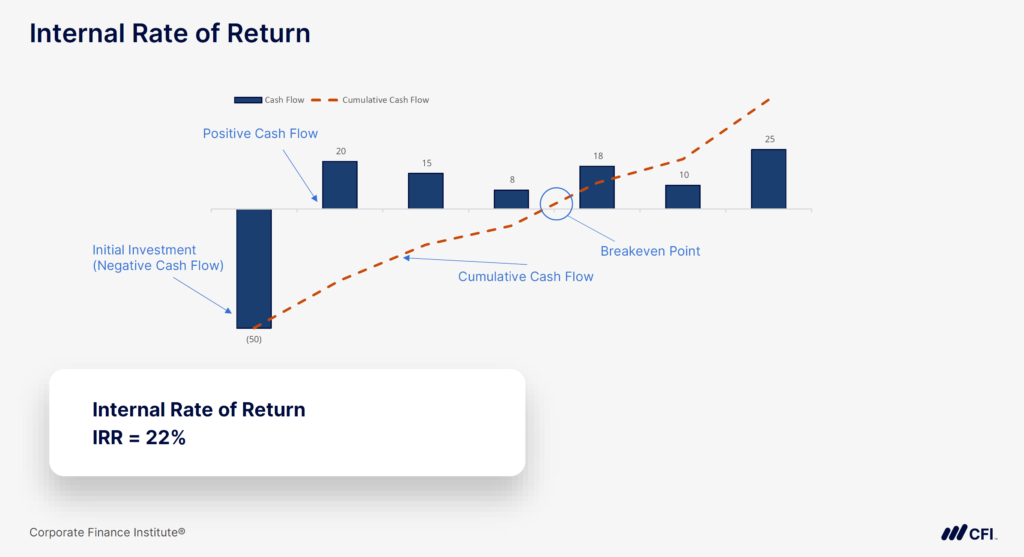
Internal Rate of Return (IRR) estimates an investment’s expected annualized return. IRR is expressed as a percentage, which makes it helpful for comparing projects of different sizes, unlike NPV, which is presented as a dollar amount.
At its core, IRR is the discount rate that makes a project’s NPV equal to zero. In other words, it represents the break-even rate of return an investment must achieve to avoid losing value.
Companies commonly use IRR to compare potential investments and determine whether a project’s expected return meets or exceeds the company’s required rate of return (also called the hurdle rate).
A company is evaluating a $2 million expansion project projected to yield returns over the next seven years. After modeling expected cash flows, the IRR is calculated at 14%.
Finance professionals often use both IRR and NPV together to get a more complete picture of an investment’s attractiveness. While IRR provides a relative measure of return, NPV accounts for absolute value creation, making them complementary tools.
Ready to calculate and apply IRR? CFI’s in-depth IRR guide walks you through the formula and how to interpret the results.
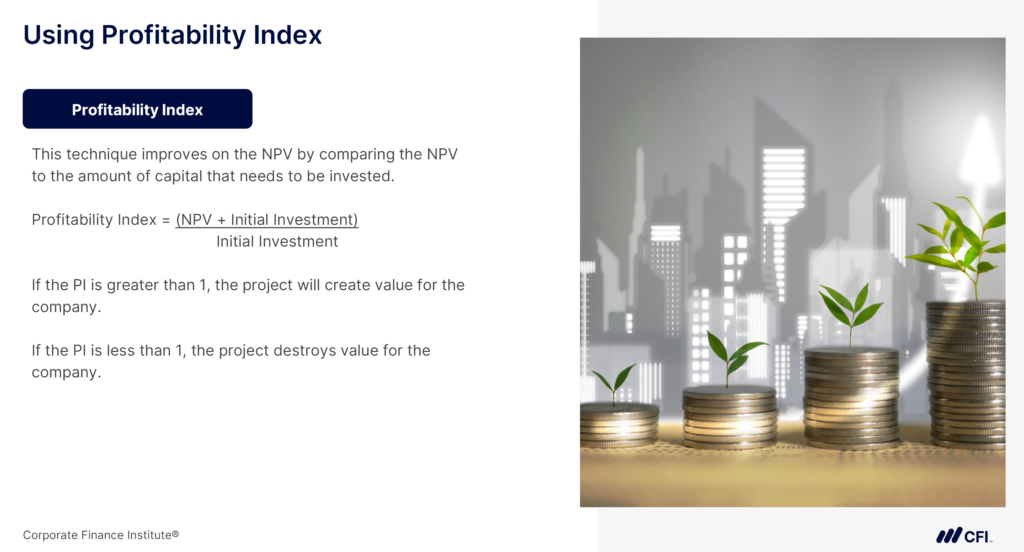
The Profitability Index (PI) measures the value a project creates for every dollar invested, making it especially useful when companies must choose between multiple projects but have limited capital.
While NPV assesses total profitability, PI evaluates investment efficiency. This helps businesses prioritize projects that generate the highest return per dollar spent.
Imagine a business with a $5 million budget for new projects but receives $10 million in proposals from different departments. Since not every project can be approved, management must prioritize investments that create the most value per dollar spent.
Instead of selecting projects based purely on the highest NPV, businesses use PI to rank investments by efficiency, ensuring that available capital generates the greatest possible return.
A company must choose between three projects but only has enough capital to fund one:
If selecting a project based only on NPV, Project C would be chosen because it generates $1.5 million in net value.
However, based on PI, Project A is the best option because it creates $1.50 in value per $1 invested vs. Project C’s $1.30 in value per $1 invested.
When capital is unlimited, companies typically rely on NPV to maximize total returns. But when resources are constrained, PI helps businesses rank and select the most efficient investments.
For more details, explore CFI’s guide to the Profitability Index.
Every capital planning metric serves a different purpose. NPV measures total value creation, IRR helps compare investment efficiency, and PI ensures capital is deployed effectively when resources are limited.
Understanding the strengths and limitations of each metric is critical for making well-informed investment decisions. The table below outlines how PV, NPV, IRR, and PI compare across different dimensions:
| Net Present Value (NPV) | Total value in today’s dollars | Evaluating profitability of long-term projects | Accounts for all future cash flows and risk | Requires estimating an appropriate discount rate |
| Internal Rate of Return (IRR) | Percentage return of an investment | Comparing projects with different investment sizes | Easy to interpret as a percentage return | Can be misleading when cash flows are unconventional |
| Profitability Index (PI) | Value created per dollar invested | Ranking projects when capital is limited | Ensures efficient capital allocation | Does not measure total profitability |
Each of these metrics plays a distinct role in capital planning, and no single metric should be used in isolation. In practice, companies rarely rely on just one metric. For example, a project with a high IRR may seem attractive, but if its NPV is negative, it won’t generate long-term value.
With multiple metrics, finance professionals get a more complete picture of potential capital investments for informed decision-making. This approach helps balance short-term liquidity with long-term profitability, ensuring capital is allocated strategically.
Capital planning requires balancing risk, return, and resource allocation. NPV, IRR, and PI provide a structured way to evaluate investments and ensure capital is allocated efficiently.
By combining these capital planning metrics, finance professionals gain a clearer picture of investment viability, helping businesses make data-driven decisions that support long-term growth.
Take the next step to build your corporate finance expertise! Enroll in CFI’s Corporate Finance Fundamentals course to develop practical skills to assess capital investments, structure financing, and create value for your organization.
Enroll in Corporate Finance Fundamentals now!


