Get Certified for Financial Modeling (FMVA)®
Gain in-demand industry knowledge and hands-on practice that will help you stand out from the competition and become a world-class financial analyst.
The ratio between the present value of future cash flows to the initial investment
The Profitability Index (PI) measures the ratio between the present value of future cash flows and the initial investment. The index is a useful tool for ranking investment projects and showing the value created per unit of investment.
The Profitability Index is also known as the Profit Investment Ratio (PIR) or the Value Investment Ratio (VIR).

The formula for the PI is as follows:

or

Therefore:
The higher the profitability index, the more attractive the investment.
Company A is considering two projects:
Project A requires an initial investment of $1,500,000 to yield estimated annual cash flows of:
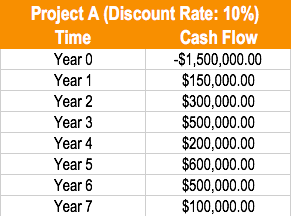
The appropriate discount rate for this project is 10%.
Project B requires an initial investment of $3,000,000 to yield estimated annual cash flows of:
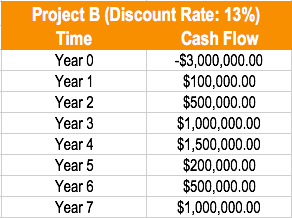
The appropriate discount rate for this project is 13%.
Company A is only able to undertake one project. Using the profitability index method, which project should the company undertake?
Using the PI formula, Company A should do Project A. Project A creates value – Every $1 invested in the project generates $.0684 in additional value.
Present value of future cash flows:
$136,363.64 + $247,933.88 + $375,657.40 + $136,602.69 + $372,552.79 + $282,236.97 + $51,315.81 = $1,602,663.18
Profitability index of Project A: $1,602,663.18 / $1,500,000 = $1.0684. Project A creates value.
Present value of future cash flows:
$88,495.58 + $391,573.34 + $693,050.16 + $919,978.09 + $108,551.99 + $240,159.26 + $425,060.64 = $2,866,869.07
Profitability index of Project B: $2,866,869.07 / $3,000,000 = $0.96. Project B destroys value.
Download CFI’s Excel template to advance your finance knowledge and perform better financial analysis.
Example: A company allocates $1,000,000 to spend on projects. The initial investment, present value, and profitability index of these projects are as follows:
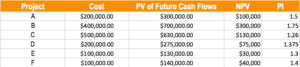
The incorrect way to solve this problem would be to choose the highest NPV projects: Projects B, C, and F. This would yield an NPV of $470,000.
The correct way to solve this problem would be to choose the projects starting from the highest profitability index until cash is depleted: Projects B, A, F, E, and D. This would yield an NPV of $545,000.
Connect what you just learned to a clear career path with CFI’s role‑based courses and certification programs.
Thank you for reading this CFI guide. To continue learning, you may find the CFI resources listed below helpful:


