When analyzing a typical project, it is important to distinguish between the figures returned by NPV vs IRR, as conflicting results arise when comparing two different projects using the two indicators.
Typically, one project may provide a larger IRR, while a rival project may show a higher NPV. The resulting difference may be due to a difference in cash flow between the two projects. Let’s have a look first at what each of the two discounting rates stands for.
What is NPV?
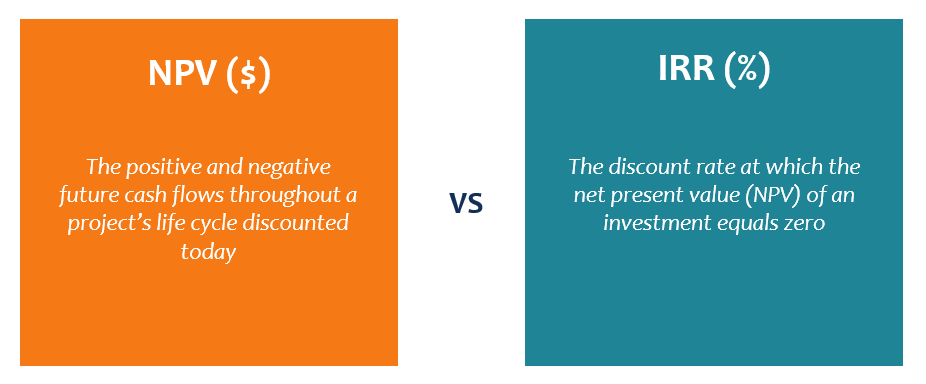
NPV stands for Net Present Value, and it represents the positive and negative future cash flows throughout a project’s life cycle discounted today. NPV represents an intrinsic appraisal, and it’s applicable in accounting and finance where it is used to determine investment security, assess new ventures, value a business, or find ways to effect a cost reduction.
What is IRR?
IRR or Internal Rate of Return is a form of metric applicable in capital budgeting. It is used to estimate the profitability of a probable business venture. The metric works as a discounting rate that equates NPV of cash flows to zero.
Differences Between NPV vs IRR
Under the NPV approach, the present value can be calculated by discounting a project’s future cash flow at predefined rates known as cut off rates. However, under the IRR approach, cash flow is discounted at suitable rates using a trial and error method that equates to a present value. The present value is calculated to an amount equal to the investment made. If IRR is the preferred method, the discount rate is often not predetermined, as would be the case with NPV.
NPV takes cognizance of the value of capital cost or the market rate of interest. It obtains the amount that should be invested in a project in order to recover projected earnings at current market rates from the amount invested.
On the other hand, the IRR approach doesn’t look at the prevailing rate of interest on the market, and its purpose is to find the maximum rates of interest that will encourage earnings to be made from the invested amount.
NPV’s presumption is that intermediate cash flow is reinvested at cutoff rate, while under the IRR approach, an intermediate cash flow is invested at the prevailing internal rate of return. The results from NPV show some similarities to the figures obtained from IRR under a similar set of conditions. At the same time, both methods offer contradicting results in cases where the circumstances are different.
NPV’s predefined cutoff rates are quite reliable compared to IRR when it comes to ranking more than two project proposals.
Similarities of Outcomes under NPV vs IRR
Both methods show comparable results regarding “accept or reject” decisions where independent investment project proposals are concerned. In this case, the two proposals don’t compete, and they are accepted or rejected based on the minimum rate of return on the market.
Conventional proposals often involve a cash outflow during the initial stage and are usually followed by a number of cash inflows. Such similarities arise during the process of decision-making. With NPV, proposals are usually accepted if they have a net positive value. In contrast, IRR is often accepted if the resulting IRR has a higher value compared to the existing cutoff rate. Projects with a positive net present value also show a higher internal rate of return greater than the base value.
Conflicts Between NPV vs IRR
In the case of mutually exclusive projects that are competing such that acceptance of either blocks acceptance of the remaining one, NPV and IRR often give contradicting results. NPV may lead the project manager or the engineer to accept one project proposal, while the internal rate of return may show the other as the most favorable. Such a kind of conflict arises due to a number of problems.
For one, conflicting results arise because of substantial differences in the amount of capital outlay of the project proposals under evaluation. Sometimes, the conflict arises due to issues of differences in cash flow timing and patterns of the project proposals or differences in the expected service period of the proposed projects.
When faced with difficult situations and a choice must be made between two competing projects, it is best to choose a project with a larger positive net value by using cutoff rate or a fitting cost of capital.
The reason the two abovementioned options works is because a company’s objective is maximizing its shareholder’s wealth, and the best way to do that is choosing a project that comes with the highest net present value. Such a project exerts a positive effect on the price of shares and the wealth of shareholders.
So, NPV is much more reliable when compared to IRR and is the best approach when ranking projects that are mutually exclusive. Actually, NPV is considered the best criterion when ranking investments.
Final Word
Both NPV and IRR are sound analytical tools. However, they don’t always agree and tell us what we want to know, especially when there are two competing projects with equally favorable alternatives. That said, most project managers prefer to use NPV because it is considered the best when ranking mutually exclusive projects.
More Resources
Thank you for reading CFI’s guide to the similarities and differences between NPV vs IRR. To keep advancing your career, the additional resources below will be useful:
CFI is a global provider of financial modeling courses and of the FMVA Certification. CFI’s mission is to help all professionals improve their technical skills. If you are a student or looking for a career change, the CFI website has many free resources to help you jumpstart your Career in Finance. If you are seeking to improve your technical skills, check out some of our most popular courses. Below are some additional resources for you to further explore:
Below is a break down of subject weightings in the FMVA® financial analyst program. As you can see there is a heavy focus on financial modeling, finance, Excel, business valuation, budgeting/forecasting, PowerPoint presentations, accounting and business strategy.
A well rounded financial analyst possesses all of the above skills!
Additional Questions & Answers
CFI is the global institution behind the financial modeling and valuation analyst FMVA® Designation. CFI is on a mission to enable anyone to be a great financial analyst and have a great career path. In order to help you advance your career, CFI has compiled many resources to assist you along the path.
In order to become a great financial analyst, here are some more questions and answers for you to discover:
Take your learning and productivity to the next level with our Premium Templates.
Upgrading to a paid membership gives you access to our extensive collection of plug-and-play Templates designed to power your performance—as well as CFI's full course catalog and accredited Certification Programs.
Gain unlimited access to more than 250 productivity Templates, CFI's full course catalog and accredited Certification Programs, hundreds of resources, expert reviews and support, the chance to work with real-world finance and research tools, and more.