Mastering Data Storytelling: Turning Raw Data into Impactful Narratives

A comprehensive guide to crafting compelling data stories

Introduction to Data Storytelling

Data Storytelling

Data analysts, business intelligence analysts, and even data scientists are always looking to turn raw data into valuable insights. Data storytelling adds another layer to this by presenting insights within a narrative that helps tie different stages of the analysis together. A data story generally combines a number of visuals and charts to guide a user through a sequence of insights.

While single charts and graphs are good at highlighting individual data points, effective data storytelling weaves data points into a coherent and compelling narrative, making it easier for the audience to understand, remember, and act upon the information.

The story may help viewers better understand root causes or answer follow-up questions such as “Why did this happen?”, “What were the most influential factors?”, or “Which is the most important data point?”

Key Highlights

  • Individual visuals help us turn data into insights that highlight a specific metric or trend.
  • Data storytelling, on the other hand, is the art of tying visuals together in a clear narrative that not only communicates insights but helps the intended audience answer their most pressing questions.
  • A good data story starts with general trends, explores the subject, and finishes by identifying actionable insights that can be acted upon to change the course of the business.

Data Storytelling vs. Visuals, Charts, and Dashboards

While visuals, charts, and dashboards are essential tools for data analysis and presentation, they serve different purposes compared to data stories.

  • Visuals and Charts: Charts are graphical representations of data designed to make data easier to understand at a glance. They are excellent for highlighting specific trends or comparisons or simplifying complex data but are usually focused on one or two specific metrics or key insights.
  • Dashboards: Dashboards provide a collection of visuals and charts that offer an overview of key metrics and performance indicators and help us analyze data across a number of visuals at the same time. They are interactive and customizable, making them powerful tools for monitoring and analyzing data.
  • Data Stories: Data stories are simply a technique that can help us make dashboards or presentations more effective. They ensure that visuals and charts are structured and organized into a narrative, providing context and insights that explain the data’s significance. This approach not only highlights what the data shows but also why it matters, what the root causes might be, or perhaps what actions should be taken.

Example Data Story — How We Constantly Improve CFI Courses

Let’s take a look at an example of a data story in the context of CFI’s finance courses. CFI is in the business of finance education. We use learner feedback to constantly improve our courses and resources.

Below, you’ll see how some of our internal data helps us ask a series of more and more specific questions, creating an effective data story that helps us continually improve our learning materials.

What’s the high-level problem?

  • A high-level dashboard or KPI might help us see an overall number each month, giving us an overview of all course reviews for that period. Generally, our review scores are fairly stable and industry-leading, and it’s important for us to keep it that way.
  • Suppose one month we see a dip in the course review scores. The subsequent data story helps us identify the problem and fix it.
  • After seeing our reviews dip, we’re on a mission to find out why and what we can do about it.
  • A chart with individual review scores by course might help us identify if the problem is widespread or limited to a specific course.

Where, exactly, is the problem?

  • Let’s suppose we’ve identified the problem. What next? How can we work out what’s wrong with it?
  • That’s where the next chart comes in, allowing us to view the likes and dislikes learners leave us on a lesson-by-lesson basis.
  • These feedback points help us act quickly when issues pop up, helping us maintain an exceptional bank of up-to-date material.

What should we change?

  • Ok, so we’ve identified the problem lesson. What, exactly, should we change about it?
  • Here, we look at the written feedback left about each lesson. Using this, we’re able to adjust the learning experience and continually improve our learning resources.

Within this data story, you can see how we start from a high-level insight and work our way down through different questions until we identify a specific action that needs to be taken to improve our course. You can also see how important learner feedback is to us and, therefore, how quickly we’re able to act on it to improve the experience.

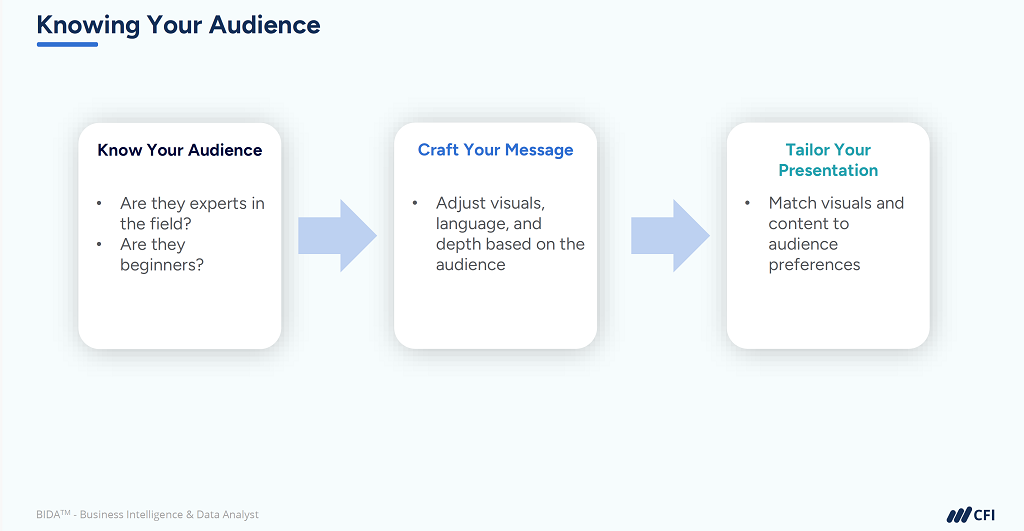
Data Visualization & Dashboards Course - Knowing Your Audience
Image from CFI’s Data Visualization & Dashboards – The Basics Course

When to Use a Data Story

Whenever you present data, you should consider weaving these insights together using data storytelling. Consider the following questions, which can help you expand your presentation around a core question.

  • What does the audience already know about the problem?
  • Can you help them understand why this metric is important?
  • [Core Question] What is happening with the actual metric of interest? Is it improving or getting worse?
  • What might be driving this change? Is a particular segment of our analysis causing this?
  • What are the consequences of this change in the core metric?
  • How can we solve this problem?

With even a few simple questions, we can expand our thought process from one that considers only the core metric to one that tries to make the core metric relevant to the business, weave it into a story, and help decision makers understand what needs to be done.

The Elements of a Good Data Story

A successful data story includes several key elements:

  1. Clear Objective: Define the purpose of your story and what you aim to achieve with it. What is the problem you are trying to solve?
  2. Audience Understanding: Tailor your story to the needs and knowledge level of your audience. You may need to explain acronyms or background information a little more for certain audiences.
  3. Compelling Narrative: Structure your data into a logical and engaging storyline with a clear beginning, middle, and end.
  4. Relevant & Simple Data: Use accurate and relevant data to support your narrative. Keep charts and metrics as simple as possible to convey the required message.
  5. Effective Visuals: Incorporate well-designed charts and visuals to enhance understanding and engagement.
  6. Actionable Insights (“So What?”): Provide clear recommendations or actions based on the data insights. This ensures that you always have a clear answer to the most important question you’ll be asked, which is, “So what should we be doing differently, based on your analysis?”
  7. Test and Iterate: Continuously refine your story based on feedback and results. If your audience finds something confusing, it probably is.

Conclusion

Data storytelling is a powerful tool for turning data insights and complex information into simple visual narratives that drive action. By understanding the differences between data stories, visuals, and dashboards, and following best practices, you can craft impactful stories that not only inform but also enable your audience to make better decisions.

Additional Resources

Thank you for reading CFI’s guide on Data Storytelling. To keep advancing your career and skills, the following CFI resources will be useful:

Data Presentation

Data Visualization

Data Foundations: Fueling the AI Revolution in Business

Data Visualization & Dashboards – The Basics (CFI Course)

See all Business Intelligence resources

0 search results for ‘