
Get In-Demand Finance Certifications
Step-by-step guide
This article aims to provide readers with an easy to follow, step-by-step guide to forecasting balance sheet items in a financial model in Excel, including property, plant, and equipment (PP&E), other non-current operating assets, and various components of working capital.
To begin, we will forecast the balance sheet by learning how to model operating assets, such as PP&E, accounts receivable, inventories, and accounts payable.
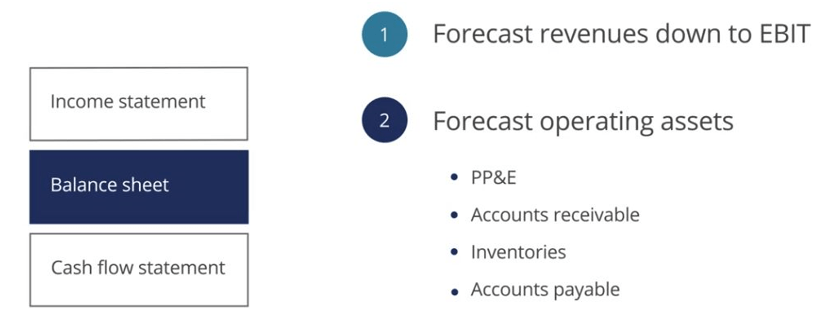
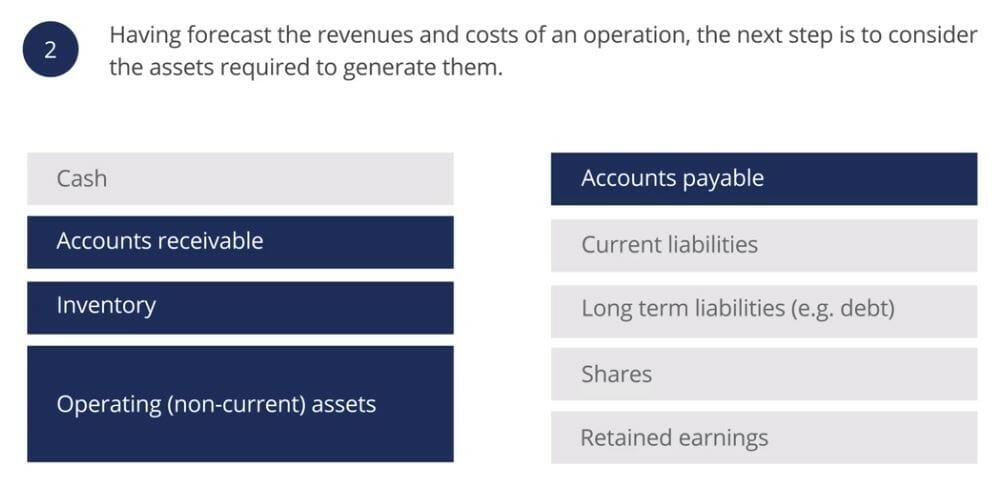
When preparing a financial forecast, the first step is to forecast the revenues and operating costs, the next step is to forecast the operating assets required to generate them. For now, we will exclude the financing items on the balance sheet and only forecast operating (non-current) assets, accounts receivable, inventories, and accounts payable.
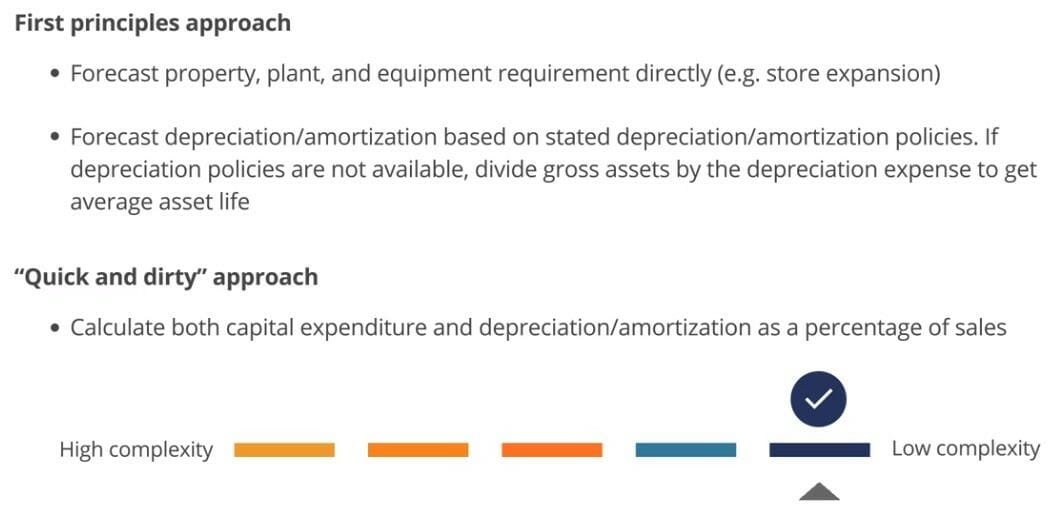
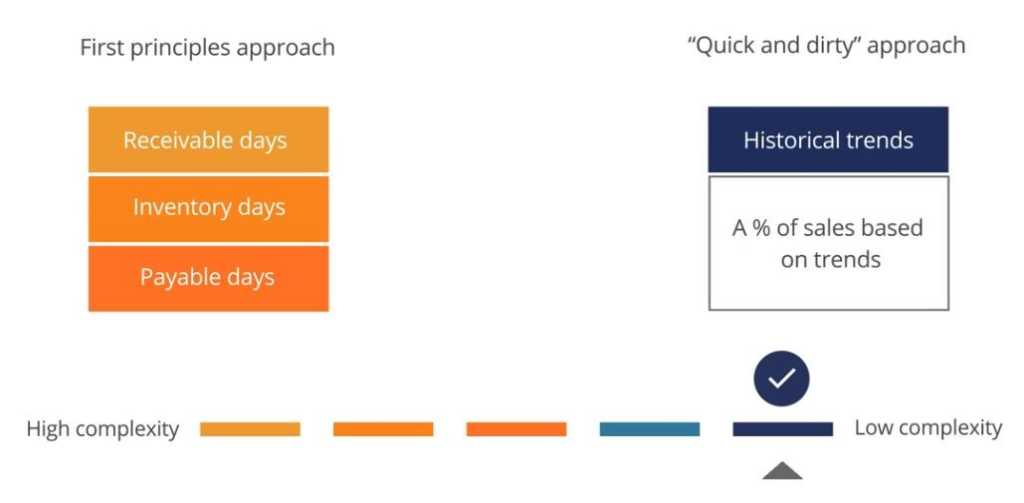
Before we begin to forecast, it is important to remind ourselves of the first principles approach and the “quick and dirty” approach. Applying the first principles approach in forecasting balance sheet items will provide high levels of detail and precision in the model, even though it is more challenging to follow and audit.
On the other hand, the “quick and dirty” approach will allow us to build a model in a much more straightforward way with the benefit that our model will be simpler and easier to follow and audit. The other simplification benefit related to the latter approach is that linking PP&E to revenues ensures that as revenues grow, PP&E also grows.
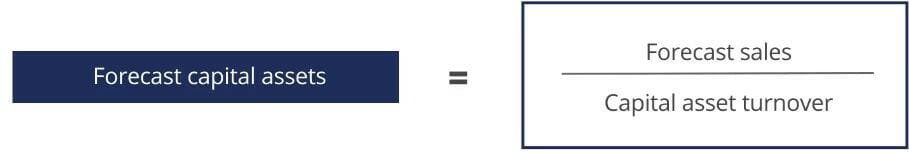
The capital asset turnover ratio is often used to link capital asset forecasting directly to revenue. This first formula defines the capital asset turnover ratio:

The second formula shows how we can use forecast sales and capital asset turnover to forecast capital assets. The capital asset turnover ratio is often used to link capital asset forecasting directly to revenue. This first formula defines the capital asset turnover ratio:
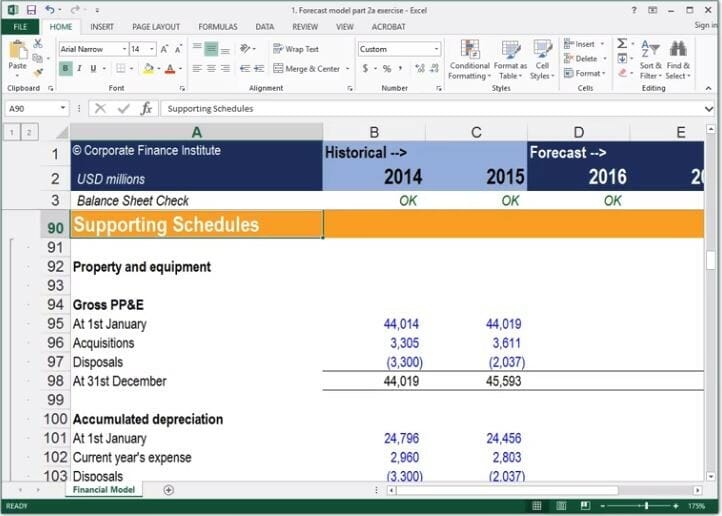
In a more complex forecast, we may need to break down PP&E into further detailed items. In order to do this easily within a model, the best approach is to put the PP&E breakdown in a supporting schedule.
In our financial modeling exercise, we put all our supporting schedules in another section to keep our building blocks for input processing and outputs separate. Breaking down the calculations will allow us to identify forecast acquisitions and disposals, which are necessary to complete a cash flow forecast.
When forecasting PP&E from first principles, we typically start by forecasting acquisitions and disposals and then work down to PP&E net book value.
When forecasting PP&E using the “quick and dirty” approach, we do the reverse and start from PP&E net book value and work upwards to acquisitions and disposals.
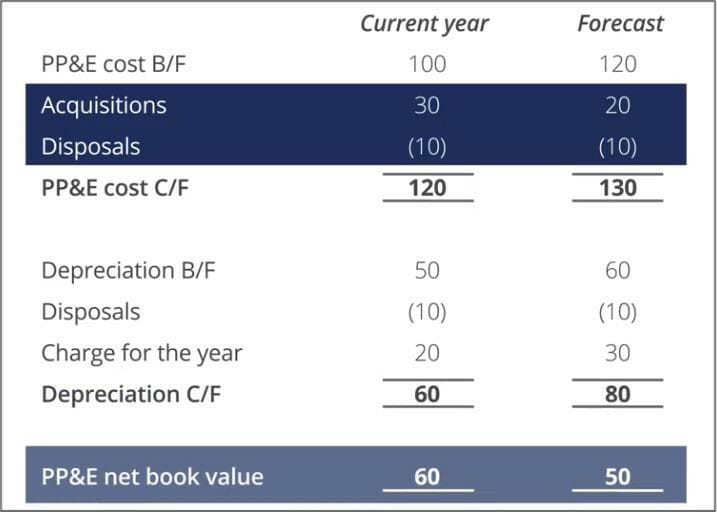
Disposals can be forecast based on the historical relationship between the gross cost of opening PP&E and the gross cost of disposals.
The first-principles approach to forecasting working capital typically involves forecasting individual current assets and current liabilities using various working capital ratios, such as receivable days, inventory days, and payable days. Alternatively, we can calculate working capital as one item in a “quick and dirty” way based on historic trends.
Cash, although often considered part of the working capital, will be forecast as a financing item later.
The first working capital item that we will forecast is accounts receivable. The receivable days ratio is often used to link forecast receivables to revenue. The first formula defines the account receivable days ratio:
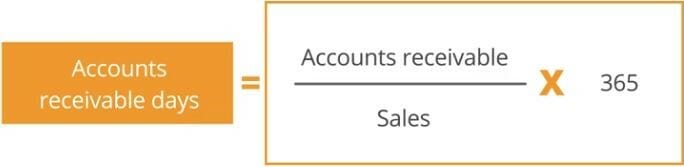
The second formula shows how we can use forecast sales and receivable days to forecast receivables:

After forecasting receivables, we can then forecast accounts payable. In a similar manner, the accounts payable days ratio can be used to link forecast payables to the cost of sales. If the cost of sales data is not available, then it can be replaced with revenues. The first formula defines the accounts payable days ratio:

The second formula shows how we can use forecast cost of sales/revenues and payable days to forecast accounts payable:

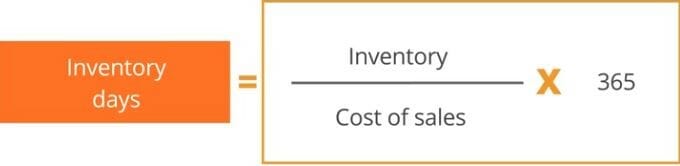
The last working capital item to forecast is inventories. The inventory days ratio can be used to forecast inventory to cost of sales. Once again, if the cost of sales is not available, revenues can be used instead. The first formula defines the inventory days ratio:
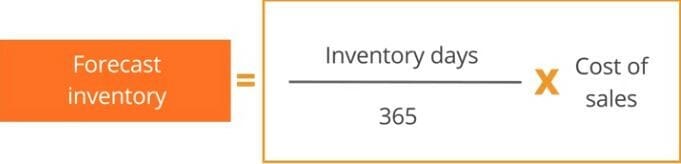
The second formula shows how we can use the forecast cost of sales/revenues and inventory days to forecast inventories.
The key takeaways from this article include:
Thank you for reading CFI’s guide to Forecasting Balance Sheet Items in a Financial Model. To keep advancing your career, the additional CFI resources below will be useful:
Below is a break down of subject weightings in the FMVA® financial analyst program. As you can see there is a heavy focus on financial modeling, finance, Excel, business valuation, budgeting/forecasting, PowerPoint presentations, accounting and business strategy.

A well rounded financial analyst possesses all of the above skills!
CFI is the global institution behind the financial modeling and valuation analyst FMVA® Designation. CFI is on a mission to enable anyone to be a great financial analyst and have a great career path. In order to help you advance your career, CFI has compiled many resources to assist you along the path.
In order to become a great financial analyst, here are some more questions and answers for you to discover:


