Get Certified for Financial Modeling (FMVA)®
Gain in-demand industry knowledge and hands-on practice that will help you stand out from the competition and become a world-class financial analyst.
Measures of a company's earning power
Profitability ratios are financial metrics used by analysts and investors to measure and evaluate the ability of a company to generate income (profit) relative to revenue, balance sheet assets, operating costs, and shareholders’ equity during a specific period of time. They show how well a company utilizes its assets to produce profit and value to shareholders.
A higher ratio or value is commonly sought-after by most companies, as this usually means the business is performing well by generating revenues, profits, and cash flow. The ratios are most useful when they are analyzed in comparison to similar companies or compared to previous periods. The most commonly used profitability ratios are examined below.
There are various profitability ratios that are used by companies to provide useful insights into the financial well-being and performance of the business.
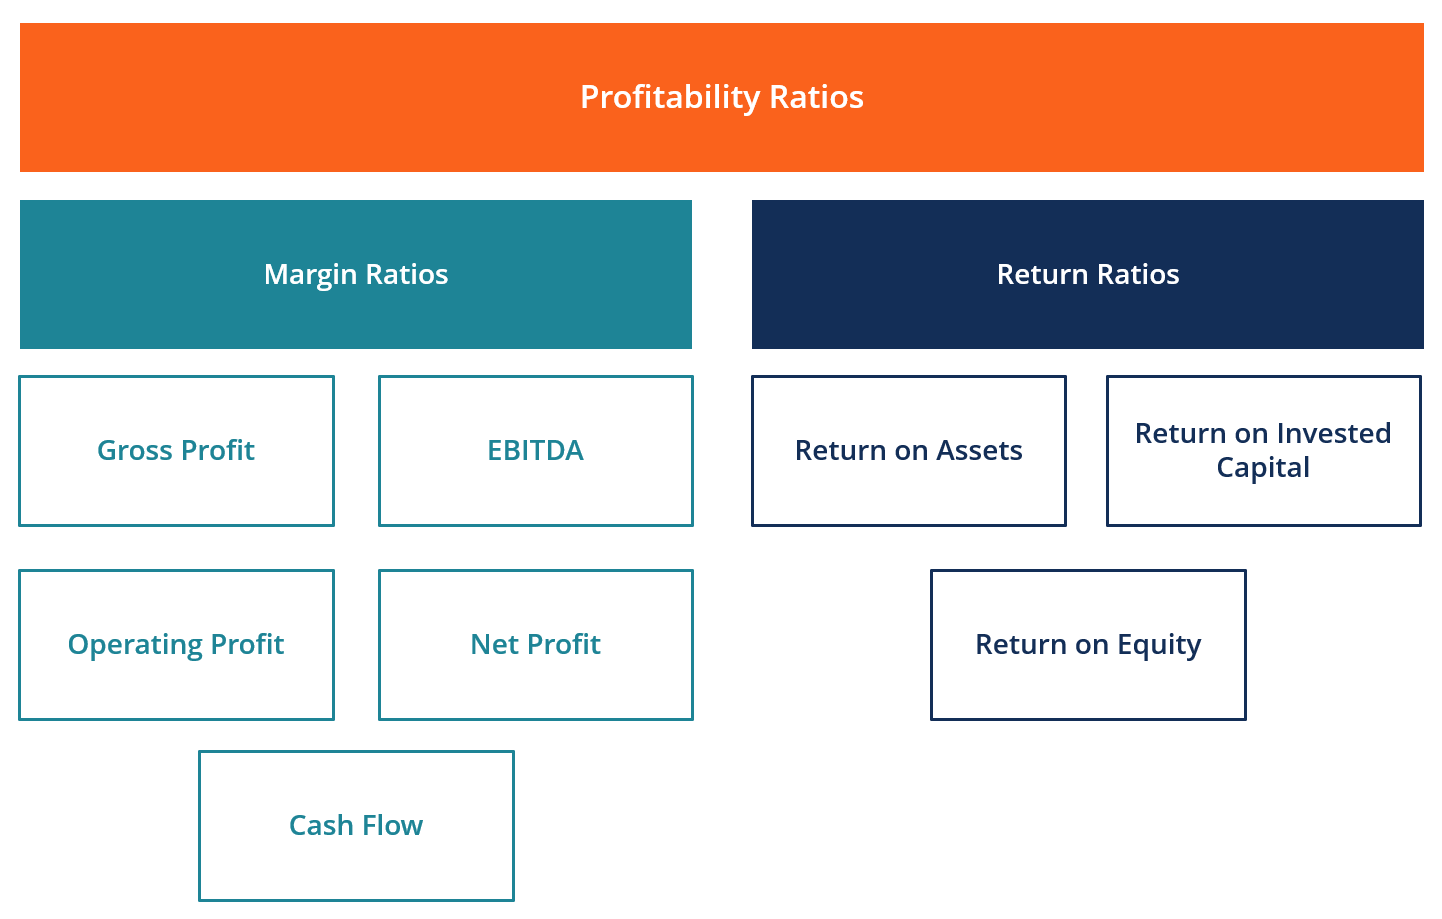
All of these ratios can be generalized into two categories, as follows:
Margin ratios represent the company’s ability to convert sales into profits at various degrees of measurement.
Examples are gross profit margin, operating profit margin, net profit margin, cash flow margin, EBIT, EBITDA, EBITDAR, NOPAT, operating expense ratio, and overhead ratio.
Return ratios represent the company’s ability to generate returns to its shareholders.
Examples include return on assets, return on equity, cash return on assets, return on debt, return on retained earnings, return on revenue, risk-adjusted return, return on invested capital, and return on capital employed.
Most companies refer to profitability ratios when analyzing business productivity by comparing income to sales, assets, and equity.
Eight of the most frequently used profitability ratios are:
Gross profit margin compares gross profit to sales revenue. This shows how much a business is earning, taking into account the needed costs to produce its goods and services. A high gross profit margin ratio reflects a higher efficiency of core operations, meaning it can still cover operating expenses, fixed costs, dividends, and depreciation, while also providing net earnings to the business.
On the other hand, a low profit margin indicates a high cost of goods sold, which can be attributed to unfavorable purchasing policies, low selling prices, low sales, intense market competition, or ineffective sales promotion policies.
Gross profit margin = (Revenue – Cost of goods sold) ÷ Revenue
A company generates 1,000 in sales and has 600 in cost of goods sold, so gross profit is 400. The gross profit margin is 400 ÷ 1,000 = 40%. This means the company keeps 40 cents in gross profit for every dollar of revenue before operating expenses.
EBITDA stands for Earnings Before Interest, Taxes, Depreciation, and Amortization. It represents the profitability of a company before taking into account non-operating items like interest and taxes, as well as non-cash items like depreciation and amortization.
The benefit of analyzing a company’s EBITDA margin is that it is easy to compare it to other companies since it excludes expenses that may be volatile or somewhat discretionary. The downside of EBTIDA margin is that it can be very different from net profit and actual cash flow generation, which are better indicators of company performance. EBITDA is widely used in many valuation methods.
EBITDA margin = EBITDA ÷ Revenue
Suppose a company has revenue of 2,000, cost of goods sold of 800, operating expenses of 500, and depreciation and amortization of 100. EBITDA is 2,000 – 800 – 500 + 100 = 800. EBITDA margin is 800 ÷ 2,000 = 40%. This shows that 40% of sales remains after operating and production costs, before interest, taxes, and non‑cash charges.
Operating profit margin looks at earnings as a percentage of sales before interest expense and income taxes are deducted. Companies with high operating profit margins are generally better equipped to pay for fixed costs and interest on obligations, are more likely to survive an economic slowdown, and are more able to offer lower prices than competitors with lower profit margins.
Operating profit margin is frequently used to assess the strength of a company’s management since good management can substantially improve the profitability of a company by managing its operating costs.
Operating profit margin = Operating income (EBIT) ÷ Revenue
A business reports 1,500 in revenue, 700 in cost of goods sold, and 400 in operating expenses. Operating income (EBIT) is 1,500 – 700 – 400 = 400. The operating profit margin is 400 ÷ 1,500 ≈ 26.7%. This indicates how much profit the core operations generate before interest and taxes.
Net profit margin is the bottom line. It looks at a company’s net income and divides it into total revenue. It provides the final picture of how profitable a company is after all expenses, including interest and taxes, have been taken into account.
One reason to use the net profit margin as a measure of profitability is that it takes everything into account. A drawback of this metric is that it includes a lot of “noise” such as one-time expenses and gains, which makes it harder to compare a company’s performance with its competitors.
Net profit margin = Net income ÷ Revenue
If a company has 2,000 in revenue and 150 in net income after all expenses, the net profit margin is 150 ÷ 2,000 = 7.5%. For every dollar of sales, the company ultimately keeps 7.5 cents as profit.
Cash flow margin expresses the relationship between cash flows from operating activities and sales generated by the business. It measures the ability of the company to convert sales into cash. The higher the percentage of cash flow, the more cash is available from sales to pay for suppliers, dividends, utilities, and service debt, as well as to purchase capital assets.
Negative cash flow, however, means that even if the business is generating sales or profits, it may still be losing money. In the instance of a company with inadequate cash flow, the company may opt to borrow funds or to raise money from investors in order to keep operations going.
Managing cash flow is critical to a company’s success because always having adequate cash flow both minimizes expenses (e.g., avoid late payment fees and extra interest expense) and enables a company to take advantage of any extra profit or growth opportunities that may arise (e.g. the opportunity to purchase at a substantial discount the inventory of a competitor who goes out of business).
Cash flow margin = Cash flow from operating activities ÷ Revenue
A company reports 1,800 in revenue and 270 in cash flow from operating activities. The cash flow margin is 270 ÷ 1,800 = 15%. This means 15% of sales is converted into operating cash that can be used to pay suppliers, fund capex, service debt, and return capital to investors.
Return on assets (ROA), as the name suggests, shows the percentage of net earnings relative to the company’s total assets. The ROA ratio specifically reveals how much after-tax profit a company generates for every one dollar of assets it holds. It also measures the asset intensity of a business. The lower the profit per dollar of assets, the more asset-intensive a company is considered to be.
Highly asset-intensive companies require big investments to purchase machinery and equipment in order to generate income. Examples of industries that are typically very asset-intensive include telecommunications services, car manufacturers, and railroads. Examples of less asset-intensive companies are advertising agencies and software companies.
ROA = Net income ÷ Average total assets
If net income is 120 and average total assets for the period are 1,500, ROA is 120 ÷ 1,500 = 8%. This indicates the company generates 8 cents of after-tax profit for every dollar invested in assets.
Return on equity (ROE) expresses the percentage of net income relative to stockholders’ equity, or the rate of return on the money that equity investors have put into the business. The ROE ratio is one that is particularly watched by stock analysts and investors. A favorably high ROE ratio is often cited as a reason to purchase a company’s stock. Companies with a high return on equity are usually more capable of generating cash internally, and therefore less dependent on debt financing.
ROE = Net income ÷ Average shareholders’ equity
Assume net income is 90 and average shareholders’ equity is 450. ROE is 90 ÷ 450 = 20%. This means the business generated a 20% return on the capital provided by equity investors over the period.
Return on invested capital (ROIC) is a measure of return generated by all providers of capital, including both bondholders and shareholders. It is similar to the ROE ratio, but more all-encompassing in its scope since it includes returns generated from capital supplied by bondholders.
The simplified ROIC formula can be calculated as: EBIT x (1 – tax rate) / (value of debt + value of + equity). EBIT is used because it represents income generated before subtracting interest expenses and, therefore, represents earnings available to all investors, not just shareholders.
Suppose a company has EBIT of 200, a tax rate of 25%, total debt of 500, and total equity of 500. After-tax operating profit is 200 × (1 – 0.25) = 150. Invested capital is 500 + 500 = 1,000. ROIC is 150 ÷ 1,000 = 15%. This suggests the company earns a 15% return on the capital contributed by both debt and equity holder
Below is a short video that explains how profitability ratios, such as net profit margin, are affected by various levers in a company’s financial statements.
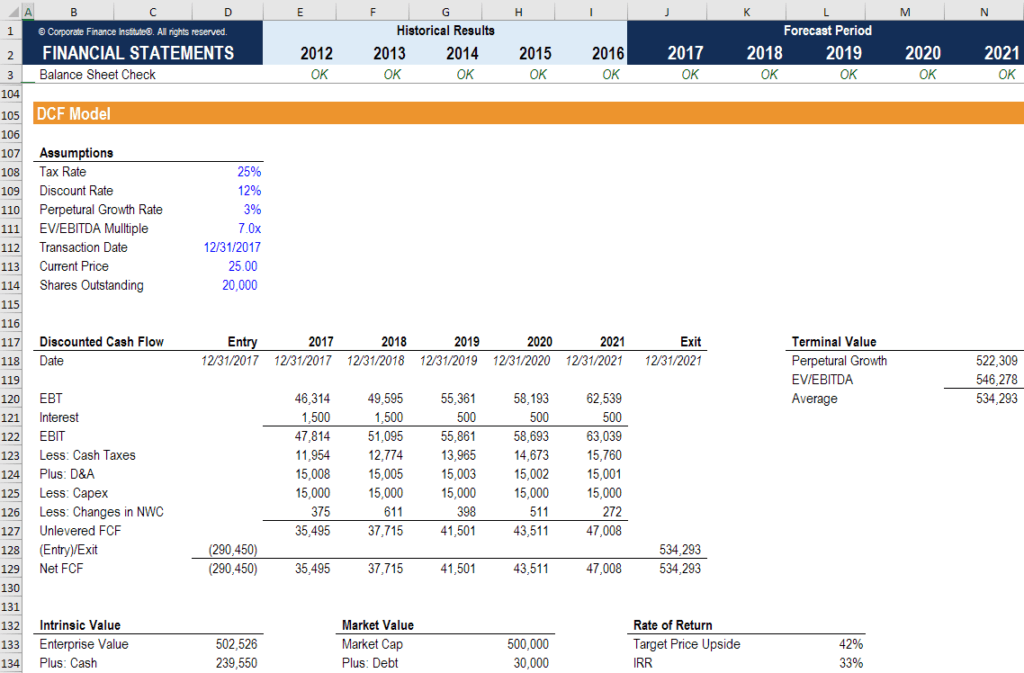
While profitability ratios are a great place to start when performing financial analysis, their main shortcoming is that none of them takes the whole picture into account. A more comprehensive way to incorporate all the significant factors that impact a company’s financial health and profitability is to build a DCF model that includes 3-5 years of historical results, a 5-year forecast, a terminal value, and that provides a Net Present Value (NPV) of the business.
In the screenshot below, you can see how many of the profitability ratios listed above (such as EBIT, NOPAT, and Cash Flow) are all factors of a DCF analysis. The goal of a financial analyst is to incorporate as much information and detail about the company as reasonably possible into the Excel model.
To learn more, check out CFI’s financial modeling courses online. Connect what you just learned to a clear career path with CFI’s role‑based courses and certification programs.
Thank you for reading this guide to analyzing and calculating profitability ratios. CFI is on a mission to help you advance your career. With that goal in mind, these additional CFI resources will help you become a world-class financial analyst:
Below is a break down of subject weightings in the FMVA® financial analyst program. As you can see there is a heavy focus on financial modeling, finance, Excel, business valuation, budgeting/forecasting, PowerPoint presentations, accounting and business strategy.

A well rounded financial analyst possesses all of the above skills!
CFI is the global institution behind the financial modeling and valuation analyst FMVA® Designation. CFI is on a mission to enable anyone to be a great financial analyst and have a great career path. In order to help you advance your career, CFI has compiled many resources to assist you along the path.
In order to become a great financial analyst, here are some more questions and answers for you to discover:


