Get Certified for Financial Modeling (FMVA)®
Gain in-demand industry knowledge and hands-on practice that will help you stand out from the competition and become a world-class financial analyst.
A free guide on how to build DCF models in Excel
A DCF model is a specific type of financial modeling tool used to value a business. DCF stands for Discounted Cash Flow, so a DCF model is simply a forecast of a company’s unlevered free cash flow discounted back to today’s value, which is called the Net Present Value (NPV). Have you been searching for discounted cash flow models? This DCF model training guide will teach you the basics step by step.
Even though the concept is simple, there is quite a bit of technical background knowledge required for each of the components mentioned above, so let’s break each of them down in further detail. The basic building block of a DCF model is the 3 statement financial model, which links the financial statements together. This DCF model training guide will take you through the steps you need to know to build one yourself.
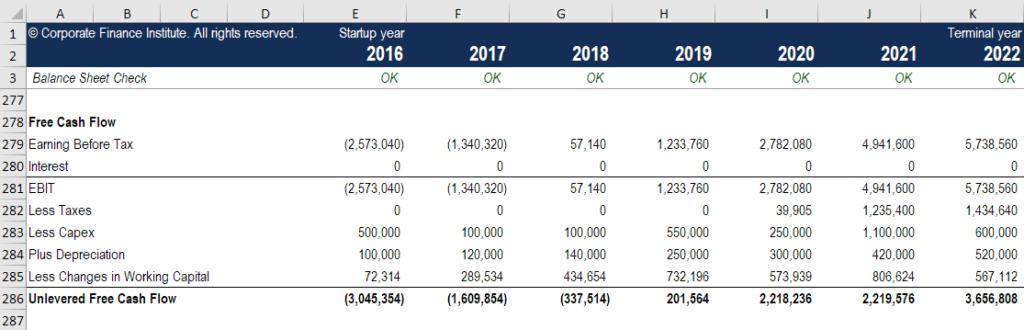
Cash flow is simply the cash generated by a business that’s available to be distributed to investors or reinvested in the business. Unlevered Free Cash Flow (also called Free Cash Flow to the Firm) – is cash that’s available to both debt and equity investors. To learn more, please read our guide on how to calculate Unlevered Free Cash Flow and how to calculate it.
Cash flow is used because it represents economic value, while accounting metrics like net income do not. A company may have positive net income but negative cash flow, which would undermine the economics of the business. Cash is what investors really value at the end of the day, not accounting profit.
Learn more about Unlevered Free Cash Flow and how to calculate it.
The cash flow that’s generated from the business is discounted back to a specific point in time (hence the name Discounted Cash Flow model), typically to the current date. The reason cash flow is discounted comes down to several reasons, mostly summarized as opportunity cost and risk, in accordance with the theory of the time value of money. The time value of money assumes that money in the present is worth more than money in the future because money in the present can be invested and thereby earn more money.
A firm’s Weighted Average Cost of Capital (WACC) represents the required rate of return expected by its investors. Therefore, it can also be thought of as a firm’s opportunity cost, meaning if they can’t find a higher rate of return elsewhere, they should buy back their own shares.
To the extent a company achieves rates of return above their cost of capital (their hurdle rate), they are “creating value.” If they are earning a rate of return below their cost of capital, then they are “destroying value.”
Investors’ required rate of return (as discussed above) generally relates to the risk of the investment (using the Capital Asset Pricing Model). Therefore, the riskier an investment, the higher the required rate of return and the higher the cost of capital.
The farther out the cash flows are, the riskier they are, and, thus, they need to be discounted further.
This is a huge topic, and there is an art behind forecasting the performance of a business. In simple terms, the job of a financial analyst is to make the most informed prediction possible about how each of the drivers of a business will impact its results in the future. See our guide to assumptions and forecasting to learn more.
Typically, a forecast for a DCF model will go out for approximately five years, except for resource or long-life industries such as mining, oil and gas, and infrastructure, where engineering reports can be used to build a long-term “life of resource” forecast. For an example of this, please see our mining financial modeling course.
There are several ways to build a revenue forecast, but broadly speaking, they fall into two main categories: growth-based and driver-based.
A growth-based forecast is simpler and makes sense for stable, mature businesses, where a basic year-over-year growth rate can be used. For many DCF models, this is sufficient.
A driver-based forecast is more detailed and challenging to develop. It requires disaggregating revenue into its various drivers, such as price, volume, products, customers, market share, and external factors. Regression analysis is often used as part of a driver-based forecast to determine the relationship between underlying drivers and top-line revenue growth.
Building an expense forecast can be a very detailed and granular process, or it can also be a simple year-over-year comparison.
The most detailed approach is called a Zero-Based Budget and requires building up the expenses from scratch without giving any consideration to what was spent last year. Typically, each department in the company is asked to justify every expense they have, based on activity.
This approach is often used in a cost-cutting environment or when financial controls are being imposed. It is only practical to be performed internally by managers of the company and not by outsiders such as investment bankers or equity research analysts.
Once most of the income statement is in place, it’s time to forecast the capital assets. PP&E is often the largest balance sheet item, and capital expenditures (CapEx), as well as depreciation, need to be modeled in a separate schedule.
The most detailed approach is to create a separate schedule in the DCF model for each of the major capital assets and then consolidate them into a total schedule. Each capital asset schedule will include several lines: opening balance, CapEx, depreciation, dispositions, and closing balance.
The change in working capital, which includes accounts receivable, accounts payable, and inventory, must be calculated and added or subtracted depending on their cash impact.
The way this section is built will depend largely on what type of DCF model you’re building. The most common approach is to simply keep the company’s current capital structure in place, assuming no major changes other than things that are known, such as debt maturity.
Since we’re using unlevered free cash flow, this section is actually not that important to the DCF model. It is, however, important if you are looking at things from the perspective of an equity investor or equity research analyst. Investment bankers typically focus on enterprise value, as it’s more relevant for M&A transactions, where the entire company is bought or sold.
The terminal value is a very important part of a DCF model. It often makes up more than 50% of the net present value of the business, especially if the forecast period is five years or less. There are two ways to calculate the terminal value: the perpetual growth rate approach and the exit multiple approach.
The perpetual growth rate approach assumes that the cash flow generated at the end of the forecast period grows at a constant rate forever. So, for example, the cash flow of the business is $10 million and grows at 2% forever, with a cost of capital of 15%. The terminal value is $10 million / (15% – 2%) = $77 million.
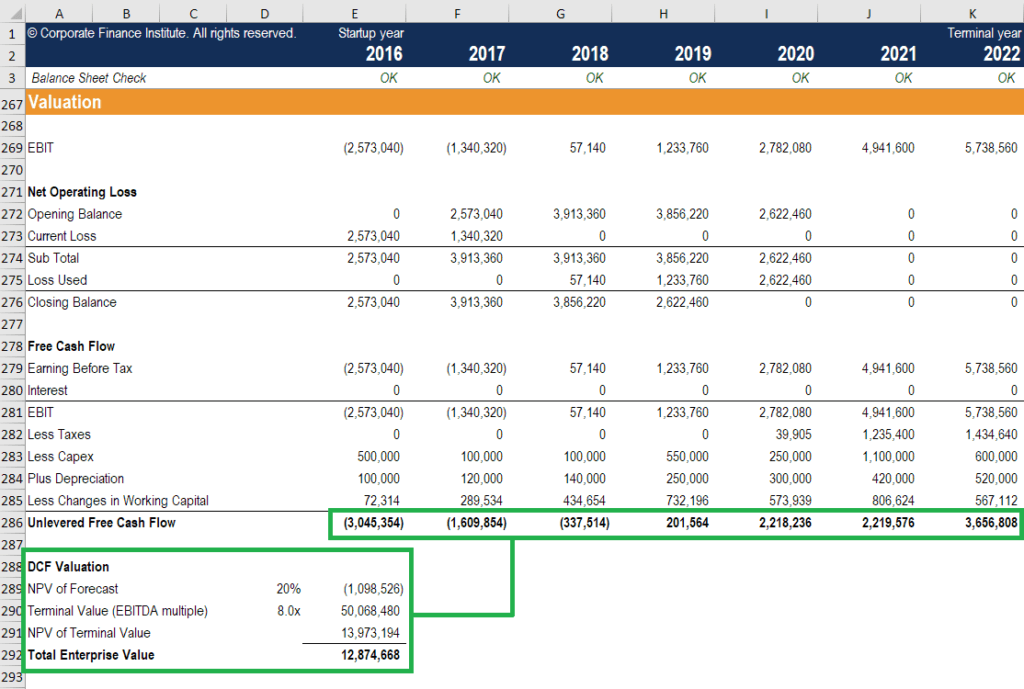
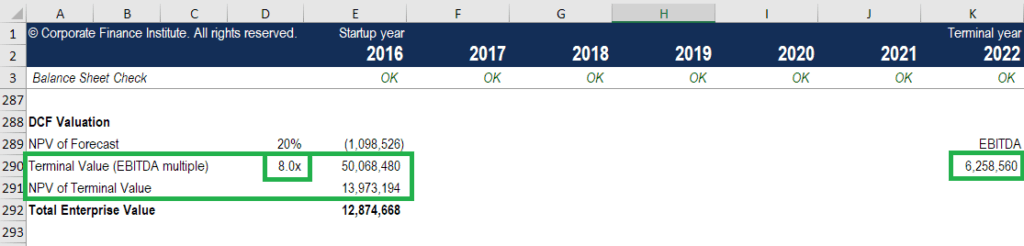
With the exit multiple approach, the business is assumed to be sold for what a “reasonable buyer” would pay for it. This typically means an EV/EBITDA multiple at or near current trading values for comparable companies. As you can see in the example below, if the business has $6.3 million of EBITDA and similar companies are trading at 8x, then the terminal value is $6.3 million x 8 = $50 million. That value is then discounted back to the present to get the NPV of the terminal value.
It’s important to pay close attention to the timing of cash flows in a DCF model, as not all the time periods are necessarily equal. There is often a “stub period” at the beginning of the model, where only a portion of the year’s cash flow is received. Additionally, the cash outflow (making the actual investment) is typically a spate time period before the stub is received.
XNPV and XIRR functions are easy ways to be very specific with the timing of cash flows when building a DCF model. The best practice is to always use these over the regular Excel NPV formula and IRR Excel functions.
When building a DCF model using unlevered free cash flow, the NPV that you arrive at is always the enterprise value (EV) of the business. This is what you need if you’re looking to value the entire business or compare it with other companies without taking into account their capital structures (i.e., an apples-to-apples comparison). For most investment banking transactions, the focus will be on enterprise value.
If you’re looking for the equity value of the business, you take the net present value (NPV) of the unlevered free cash flow and adjust it for cash and equivalents, debt, and any minority interest. This will give you the equity value, which you can divide by the number of shares and arrive at the share price. This approach is more common for institutional investors or equity research analysts, both of whom are looking through the lens of buying or selling shares.
Looking for another discounted cash flow model example? Enter your name and email in the form below and download our free DCF Model Excel template now!
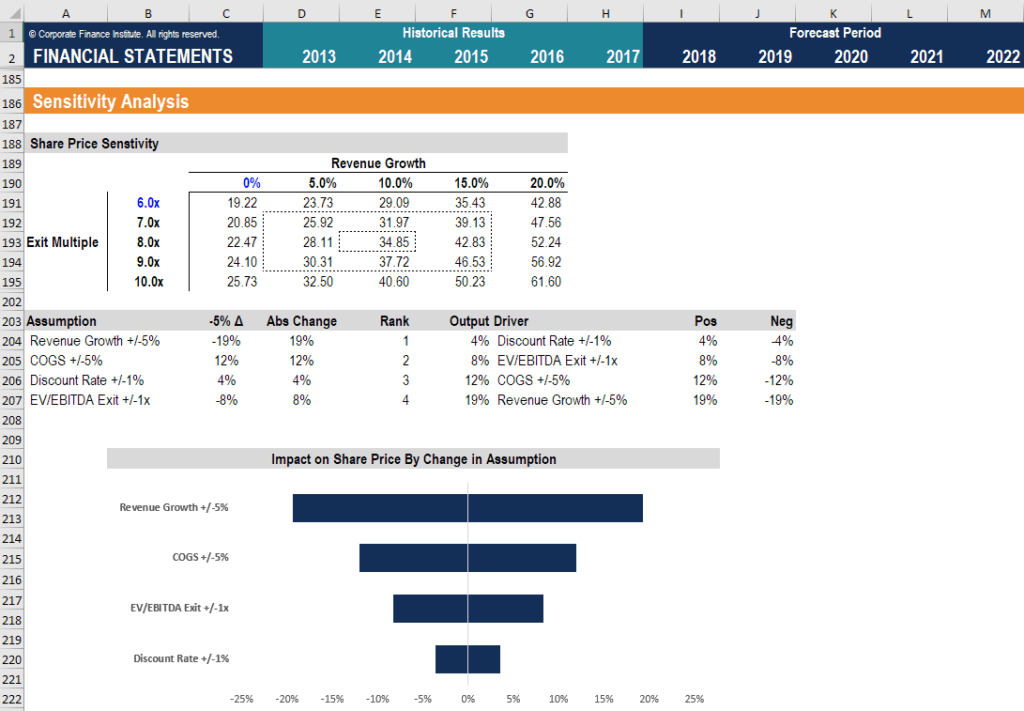
Once the DCF model is complete (i.e., you’ve arrived at the NPV of the business), then it’s time to layer on sensitivity analysis to determine what value range the business could be worth as various drivers or assumptions in the model change.
To perform this analysis, an analyst uses two main Excel tools: data tables and Goal Seek. By linking the NPV of the business to cells that influence the underlying assumptions, it’s possible to see how the value changes with various inputs.
We’ve got a bunch of resources on how to perform sensitivity analysis in Excel if you’re interested in learning how to perform it.
Watch CFI’s video explanation of how the formula works and how you can incorporate it into your financial analysis.
Connect what you just learned to a clear career path with CFI’s role‑based courses and certification programs.
CFI is the official global provider of the Financial Modeling and Valuation Analyst (FMVA)® designation. If you want to take your corporate finance career to the next level, we’ve got a wide range of financial modeling resources to get you there.
Our most popular and helpful resources for financial analysts include:


