Trading Multiples

What you need to know about trading multiples

What are Trading Multiples?

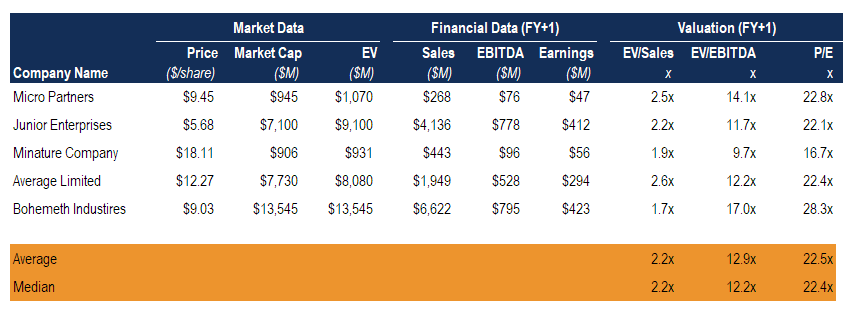
Trading Multiples are a type of financial metrics used in the valuation of a company. When valuing a company, everyone relies on the most popular method of valuation, i.e. Discounted Cash Flow (DCF), but it becomes imperative for buyers and bankers to look how the market perceives a particular stock in the same industry with a similar type of assets and the markets. For this reason, “Trading Multiples” are considered and the relative valuation is calculated.

Trading multiples are used to understand how similar companies are valued by the stock market as a multiple of Revenue, EBITDA, Earnings Per Share, EBIT, etc. The basic premise of making a comparison is that they assume that the stock markets are efficient.

Trading multiples are also called “Peer Group Analysis”, “Public Market Multiples” and “Comparable Company Analysis“.


trading multiples example


Example:

To find the “Valuation of a Telecom Company in Europe,” the trading multiples of British Telecom, Vodafone, France Telecom, Telefonica, and similar companies should be seen as they represent a similar business mix and business model.


Trading Multiples


How to identify Comparable Companies?

To find out comparable and similar companies to the one that is being valued, the parameters below needs to be obtained. One of the fastest ways to consider few companies is to look at the competitors of the target.

  • Business Mix
    • Products and services offered
    • Type of customers
    • Geographical location
  • Size
    • Revenue
    • Assets
    • EBITDA margins


Example:

In case someone wants to value a large technology company based out of the US, the probable trading multiples that will be seen are as below: (Data are as of September 2017)


CompanyMarket Cap (millions)EV / Revenue (FY1)EV / EBITDA (FY1)
Alphabet Inc.$654,5205.2x13.0x
Amazon$469,9312.6x24.6x
Facebook$499,58011.8x19.3x
Apple$847,3563.9x12.4x


Analysis of Various Multiples:

  • EV / Revenue – This is one of the most popular multiples used across industries as it is difficult to manipulate revenue figures. This multiple becomes relevant especially when a company has negative EBITDA, as the multiple EV / EBITDA will not be relevant. Start-up companies on the internet and e-commerce sector will generally have negative EBITDA in their initial years. Having said that, EV / Revenue is a poor measure as two companies with the same revenue can have a large difference in their operations, which reflects in their EBITDA. EV / Revenue is in the range of 1.0x to 3.0x.
  • EV / EBITDA – This is one of the most commonly used multiples and it acts as a proxy for free cash flows. EV / EBITDA is often in the range of 6.0x to 15.0x.
  • EV / EBIT – EBIT is derived after adjustment of depreciation and amortization as it reflects real expenses and considers wear and tear of a firm’s assets. In case of non-capital intensive companies such as consulting or technology companies, EBITDA and EBIT are somewhat close and hence multiples like EV / EBITDA and EV / EBIT are similar. Since EBIT is less than EBITDA, the multiple is higher and is in the range of 10.0x to 20.0x.
  • EV / Capital Employed – This is not one of the popular ways to calculate multiples, but is still used by capital-intensive companies. The invested capital determines potential earnings, however, it doesn’t consider differences in profitability.  
  • P / E – This valuation metric takes into consideration the price in numerator and earnings per share in the denominator. P/E multiple is similar to equity value to net income, wherein it is divided by fully diluted shares. This multiple ranges from 12.0x to 30.0x.
  • PEG Ratio – It is simply the P/E ratio divided by the EPS growth rate and is often in the range of 0.5x to 3.5x. The best part of this method is it considers the growth prospects of the company while capturing its growth rate. A company in the growth stage will have more value than a company that has reached the maturity stage.


Learn more in our guide to performing Comparable Company Analysis or our guide to M&A Precedent Transactions.


Other resources

0 search results for ‘