A drop in the value of an asset of 20% or more, most commonly used for stock market indexes
A bear market is a finance jargon used to describe a steep drop of 20% or greater in an asset from its most recent high, which may happen over the course of weeks or months and may be attributable to many reasons. The term is most commonly used to describe a sustained fall in the level of a stock market index, such as the S&P 500, the FTSE 100, or the Nikkei 225.
The term can also be used to describe a single security or commodity whose price has dropped more than 20% from its recent high. For example, Bitcoin entered a bear market in November 2021 after dropping more than 20% from its recent all-time high.
Firstly, bear markets occur fairly often and are part of the economic cycle. There isn’t anything special about the figure of 20%. However, it is a psychological and symbolic hurdle for investors of the growing risk of an economic downturn or recession. However, a bear market doesn’t always lead to a recession.
The origin of the term bear market is not certain, but one popular theory is that since bears are known to hibernate in the winter, a bear market is one where the market is retreating. The opposite of a bear market is a bull market, where assets, like a bull, are charging.
A market correction is often incorrectly used as a synonym for a bear market. The key difference between a bear market versus a market correction is the level of price decline and the duration.
A market correction is a decline of at least 10%, but less than 20%, from a recent high, and often lasts for weeks. On the contrary, a bear market is a decline greater than 20% and tends to last for months or years.
The general causes of bear markets include:
Depending on the duration of the bear market, bear markets can be defined as secular or cyclical. A secular bear market is driven by forces/influences that cause the price of securities to fall over an extended period, generally years.
On the other hand, a cyclical bear market is generally caused by normal market volatility and generally lasts for months.
The most recent example of a bear market for the S&P 500 is May 2022, but as we mentioned, it happens fairly often, the last one being March 2020.
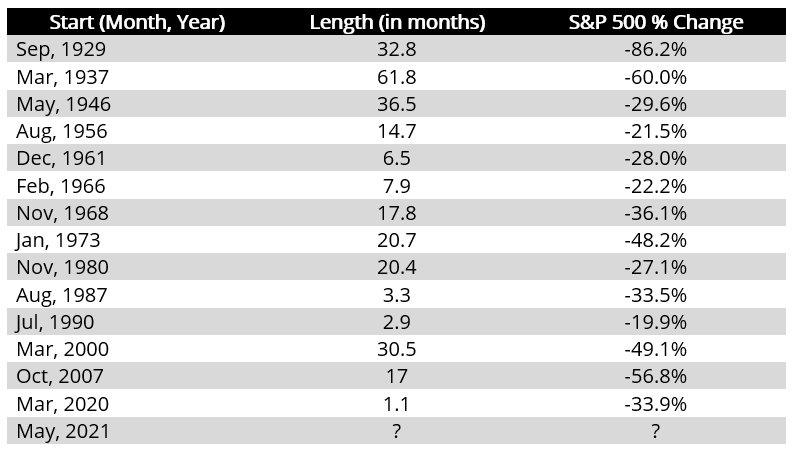
If we look at the S&P 500 stock market index in the U.S. specifically, we’ve seen 15 bear markets in the last century. Of those, nine of those drops were milder; between 20% to 40%. We’ve also seen five more severe bear markets with declines in the S&P 500 of greater than 40%, as we can see in the table below:
On average, it took eight months to fall into a bear market and 13 months to go from peak to trough. In other words, the market continues to fall on average for another five months after entering bear market territory before we see a bottom.
It is also worth noting that the faster an index falls into bear market territory, the shallower they tend to be.
Historically, when a bear market does coincide with an economic recession, however, the fall in stock market indexes tends to be greater than when it doesn’t.
While it is impossible to tell how long a bear market will last, it should be no surprise that larger overall drops take longer to recover. On average, for falls between 20%-40%, it took 14 months to recover, but an average of almost five years to recover from drops of 40% or more. The longest bear market for the S&P 500 this century ended in March 1942 and took 62 months to recover.
There are typically four stages in a bear market:
Stage 1: Recognition, which is characterized by high (positive) investor sentiment and high prices. In this phase, investors tend to initially ignore the initial onset of a bear market and mistake it for ordinary day-to-day fluctuations. At the end of this phase, some investors will recognize that a bear market is impending and start selling their securities.
Stage 2: Panic, where prices tend to fall sharply, and investors capitulate. Trading volume tends to drop, economic indicators may start pointing to a worsening economy, and investor sentiment will drop significantly.
Stage 3: Stabilization, where panic selling begins to taper off and investors start digesting the reason for the price decline. The stabilization stage is volatile, turbulent, and usually lasts the longest out of the other stages. There may be rallies that tend to reverse as market speculators enter.
Stage 4: Anticipation, where prices begin leveling off and finding a bottom. Low valuations and/or good news start attracting more investors into purchasing securities.
In a bear market, one normally expects to see the following:
However, there are a few strategies to consider in a bear market, including:
One thing to be cautious about is whether to sell everything to avoid more losses. Experts advise only doing that if you need the money now or if you want to lock in the losses for tax purposes.
Ups and downs are natural in the markets, and by dumping your stocks in a bear market, you might miss out on the market recovery. For example, when the S&P 500 entered a bear market in March 2020 from its high on February 14, 2020, the market took less than three weeks for stocks to recover and gain 20%.
Thank you for reading CFI’s guide to Bear Market. To help you advance your career, check out the additional resources below:
Access and download collection of free Templates to help power your productivity and performance.
Already have an account? Log in
Take your learning and productivity to the next level with our Premium Templates.
Upgrading to a paid membership gives you access to our extensive collection of plug-and-play Templates designed to power your performance—as well as CFI's full course catalog and accredited Certification Programs.
Already have a Self-Study or Full-Immersion membership? Log in
Gain unlimited access to more than 250 productivity Templates, CFI's full course catalog and accredited Certification Programs, hundreds of resources, expert reviews and support, the chance to work with real-world finance and research tools, and more.
Already have a Full-Immersion membership? Log in