LBO Modeling
LBO Modeling is used to value a leveraged buyout (LBO)Leveraged Buyout (LBO)A leveraged buyout (LBO) is a transaction where a business is acquired using debt as the main source of consideration. transaction where a target company is acquired using a significant amount of debt. The use of high leverage increases the potential returns on investors’ equity investments in the long-run. An LBO modelLBO ModelAn LBO model is built in Excel to evaluate a leveraged buyout (LBO) transaction, the acquisition of a company funded using a significant amount of debt. is usually built in Excel to help investors properly evaluate the transaction and realize the highest possible risk-adjusted internal rate of return (IRR)Internal Rate of Return (IRR)The Internal Rate of Return (IRR) is the discount rate that makes the net present value (NPV) of a project zero. In other words, it is the expected compound annual rate of return that will be earned on a project or investment..
Corporate Finance Institute® covers LBO modeling and transactions in-depth in our Leveraged Buyout (LBO) Financial Modeling Course!
![LBO Modeling]()
Steps to LBO Modeling
The following steps are essential to building a thorough and insightful LBO model:
1. Assumptions
Before building the LBO model, assumptions need to be made on inputs, including financing, operating metrics of the business, sources, and uses of cash, purchase price allocation, and operating scenarios.
Excel functions and formulas can be used to set up a drop-down list so that different results will be reflected in the later sections (such as the DCF model), as different scenarios are chosen.
2. Financial Statements
Once all the assumptions are laid out, the income statementIncome StatementThe Income Statement is one of a company's core financial statements that shows their profit and loss over a period of time. The profit or, balance sheet,Balance SheetThe balance sheet is one of the three fundamental financial statements. These statements are key to both financial modeling and accounting and cash flow statementCash Flow StatementA Cash Flow Statement (officially called the Statement of Cash Flows) contains information on how much cash a company has generated and used during a given period. It contains 3 sections: cash from operations, cash from investing and cash from financing. are constructed and linked using historical data. Supporting schedules such as working capitalWorking Capital FormulaThe working capital formula tells us the short-term liquid assets available after short-term liabilities have been paid off. and depreciation schedulesDepreciation ScheduleA depreciation schedule is required in financial modeling to link the three financial statements (income, balance sheet, cash flow) in Excel. are also built to calculate the corresponding line items on the financial statements.
ForecastingForecasting MethodsTop Forecasting Methods. In this article, we will explain four types of revenue forecasting methods that financial analysts use to predict future revenues. is then performed on the three financial statementsThree Financial StatementsThe three financial statements are the income statement, the balance sheet, and the statement of cash flows. These three core statements are based on the assumptions set up.
3. Transaction Balance Sheet
Before completing the full forecast on the financial statements, a transaction balance sheet needs to be built to show the pro forma balance sheet items after recapitalizationRecapitalizationRecapitalization is a type of a corporate restructuring that aims to change a company’s capital structure. It involves exchanging one type of financing for another.. The transaction balance sheet lays out the total adjustments and capital structureCapital StructureCapital structure refers to the amount of debt and/or equity employed by a firm to fund its operations and finance its assets. A firm's capital structure of the business after the LBO transaction is completed. The closing pro forma balance sheet will flow back up to the balance sheet section to drive the forecasts.
4. Debt and Interest Schedules
The debt and interest schedulesDebt ScheduleA debt schedule lays out all of the debt a business has in a schedule based on its maturity and interest rate. In financial modeling, interest expense flows model the details of all layers of debt and interest payments associated with the LBO transaction, including line of credit, term loans,Senior Term DebtSenior term debt is a loan with a priority repayment status in case of bankruptcy, and typically carries lower interest rates and lower risk. and subordinated debtSenior and Subordinated DebtIn order to understand senior and subordinated debt, we must first review the capital stack. Capital stack ranks the priority of different sources of financing. Senior and subordinated debt refer to their rank in a company's capital stack. In the event of a liquidation, senior debt is paid out first. With the debt schedules completed, the rest of the linking can be done for the financial statements.
Corporate Finance Institute® covers LBO modeling and transactions in-depth in our Leveraged Buyout (LBO) Financial Modeling Course!
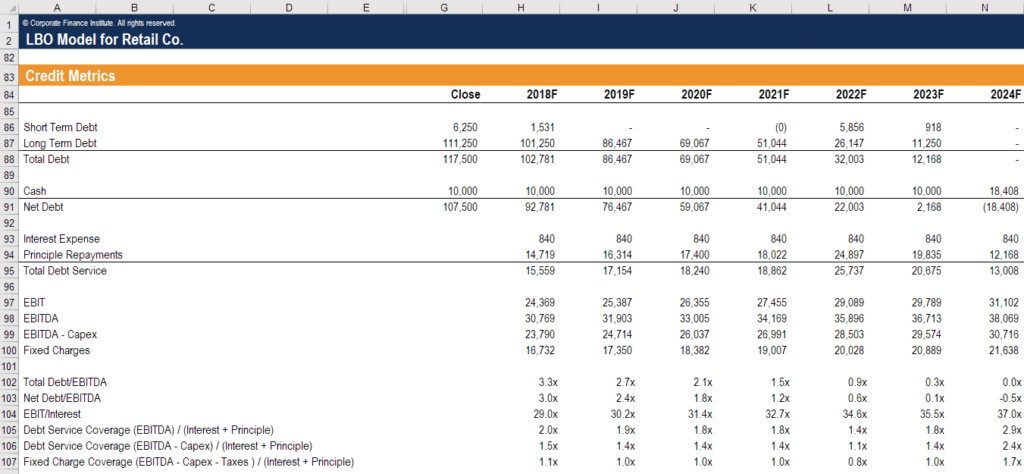
5. Credit Metrics
The credit metrics evaluate the repayment profile and look at how the company can service its debt obligations, including repayment of principal and interest. Key credit metrics in an LBO model include debt/EBITDADebt/EBITDA RatioThe net debt to earnings before interest, taxes, depreciation, and amortization (EBITDA) ratio measures financial leverage and a company’s ability to pay off its debt. Essentially, the net debt to EBITDA ratio (debt/EBITDA) gives an indication as to how long a company would need to operate at its current level to pay off all its debt., interest coverage ratioInterest Coverage RatioInterest Coverage Ratio (ICR) is a financial ratio that is used to determine the ability of a company to pay the interest on its outstanding debt., debt service coverage ratio, and fixed charge coverage ratioFixed-Charge Coverage Ratio (FCCR)The Fixed-Charge Coverage Ratio (FCCR) is a measure of a company’s ability to meet fixed-charge obligations such as interest and lease expenses..
![]()
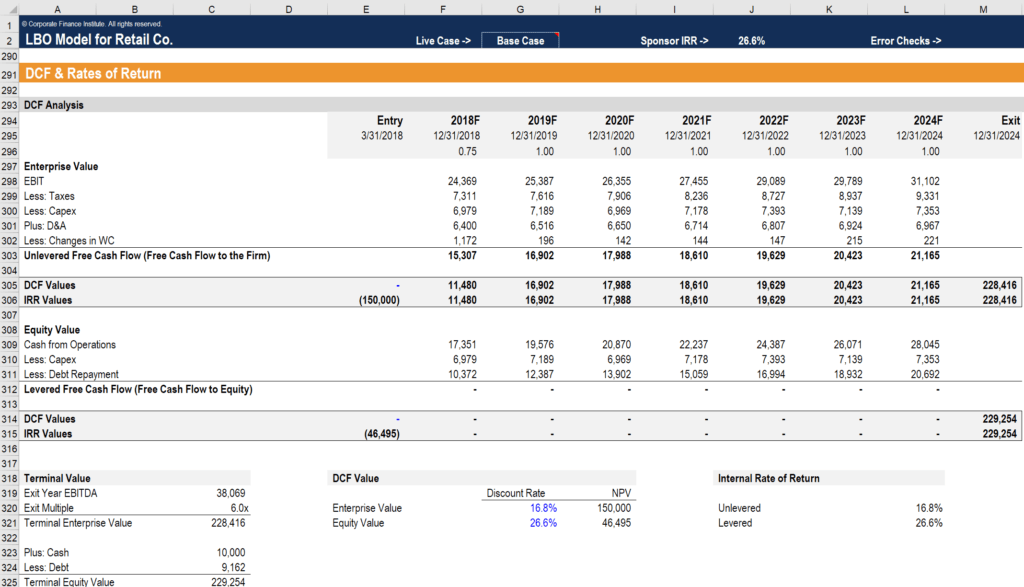
6. DCF and IRR
In the end, a DCF modelWalk me through a DCFThe question, walk me Through a DCF analysis is common in investment banking interviews. Learn how to ace the question with CFI's detailed answer guide. is built with the forecasted data. The free cash flows are calculated for each of the investor types, which are then used to find out internal rates of return (IRR)Internal Rate of Return (IRR)The Internal Rate of Return (IRR) is the discount rate that makes the net present value (NPV) of a project zero. In other words, it is the expected compound annual rate of return that will be earned on a project or investment. and net present value (NPV)Net Present Value (NPV)Net Present Value (NPV) is the value of all future cash flows (positive and negative) over the entire life of an investment discounted to the present. NPV analysis is a form of intrinsic valuation and is used extensively across finance and accounting for determining the value of a business, investment security, by investor type.
7. Sensitivity Analysis, Charts, and Graphs
Following the creation of the DCF model, sensitivity analysisWhat is Sensitivity Analysis?Sensitivity Analysis is a tool used in financial modeling to analyze how the different values for a set of independent variables affect a dependent variable can be performed to assess how the IRR will be affected when different independent variables change, holding all other assumptions unchanged.
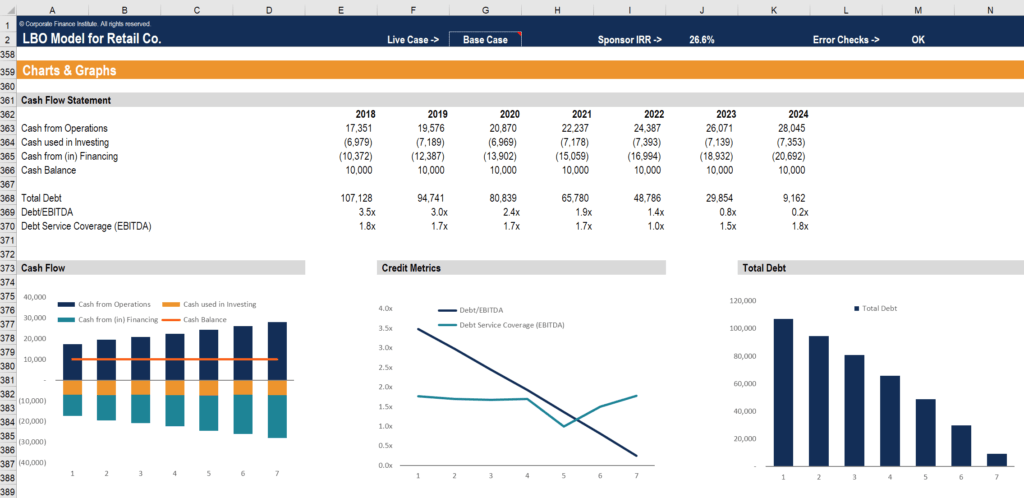
Finally, charts and graphs can be created to present the change in cash flowsFree Cash Flow (FCF)Free Cash Flow (FCF) measures a company’s ability to produce what investors care most about: cash that's available be distributed in a discretionary way and the amount of leverageLeverageIn finance, leverage is a strategy that companies use to increase assets, cash flows, and returns, though it can also magnify losses. There are two main types of leverage: financial and operating. To increase financial leverage, a firm may borrow capital through issuing fixed-income securities or by borrowing money directly from a lender. Operating leverage can over time.
![LBO Model Screenshot]()
Additional Resources
CFI is the official global provider of the Financial Modeling and Valuation Analyst (FMVA)® designationFMVA® CertificationJoin 850,000+ students who work for companies like Amazon, J.P. Morgan, and Ferrari
. Check out some of these resources below, including a course that can help you learn to model LBO transactions in more detail!
- Leveraged Buyout (LBO) Financial Modeling
- LeverageLeverageIn finance, leverage is a strategy that companies use to increase assets, cash flows, and returns, though it can also magnify losses. There are two main types of leverage: financial and operating. To increase financial leverage, a firm may borrow capital through issuing fixed-income securities or by borrowing money directly from a lender. Operating leverage can
- Debt to Equity RatioDebt to Equity RatioThe Debt to Equity Ratio is a leverage ratio that calculates the value of total debt and financial liabilities against the total shareholder’s equity.
- Three Financial StatementsThree Financial StatementsThe three financial statements are the income statement, the balance sheet, and the statement of cash flows. These three core statements are