Paper LBO Example: A Tutorial for Private Equity Interviews

What is a Paper LBO?

A paper LBO (leveraged buyout) is a simplified version of a full LBO model that is used to quickly estimate the potential returns of a leveraged buyout transaction. While a full LBO model involves detailed financial modeling, a paper LBO focuses on key assumptions and simplified calculations. A paper LBO is done without Excel or a financial calculator, with only a pen and paper, hence the name.

A paper LBO is often used as a tool to screen prospective candidates for a role in private equity. The paper LBO requires quick decision making and using approximations of key metrics such as the Internal Rate of Return (IRR) and Multiple of Invested Capital (MOIC).

Key Highlights

  • A paper LBO is a simplified version of a full leveraged buyout model used for quick estimations of potential returns. It’s primarily designed to quickly assess candidates for job interviews but may also be used for initial deal screenings. Mastering paper LBOs is crucial for careers in private equity and investment banking.
  • The process typically involves three steps: 1) using the given assumptions to calculate purchase price and how much debt and equity will be used, 2) creating a simplified financial model to calculate EBITDA and free cash flow, and 3) estimating returns.
  • As part of simplifying the model, there are several ways to reduce the number of necessary calculations. Additionally, always simplify the analysis and use round or approximate numbers when you can. To estimate the IRR, we can use the Rule of 72, the Rule of 114, or the Rule of 144.

Common Scenarios Where a Paper LBO is Used

Paper LBO models may be used in a couple of different scenarios:

  • Job Interviews: The most common, and likely, use of a paper LBO is in a job interview at a private equity (PE) firm. Paper LBOs are often used in PE interviews to test candidates’ understanding of key LBO concepts, their ability to deal with stress, think on their feet, and perform quick calculations. Paper LBOs tend to be used early on in the interview process to screen candidates.
  • Initial Deal Screening: Although less common than interviews, paper LBOs might be used in the very early stages of considering a deal or transaction. Like in an interview, the calculations would be done at a high level to see if the deal makes sense for the PE firm. Understanding the potential economics of a deal early on can help firms decide whether or not to dedicate further resources to evaluating a transaction.
  • Internal Decision Making: While not as common as the above scenarios, it’s possible that a paper LBO analysis may need to be done during an investment committee or other decision-making meeting. Normally a full LBO will have multiple scenarios already built into the model, but it’s possible that decision makers may want to see the results of a new scenario. In this case, a paper LBO may need to be performed.
  • Checking a Model: When building an LBO model (or any financial model), it’s easy to get lost in the details and miss the bigger picture. A paper LBO can be used to review a model to ensure the outputs make sense.

Regardless of the use, the goal of a paper LBO isn’t perfect accuracy but directional accuracy. In other words, is the simple analysis close enough to be generally correct?

Key Differences from a Full LBO Model

There are obviously going to be quite a few differences between a paper LBO model and a full LBO model. Here are a few of the most significant differences:

  • Detail Level: A full LBO model includes highly detailed projections of the three key financial statements. As part of this, special attention is paid to calculating free cash flow and accurately modeling the debt financing and debt paydown. In contrast, a paper LBO uses simple estimates and assumptions.
  • Time: A full LBO model can take hours to build (sometimes days!), with multiple scenarios and metrics. A paper LBO is designed to be completed quickly; the time can be as short as five minutes but usually not longer than 15 minutes.
  • Comprehensive Outputs: In a full LBO model, the goal is to produce a detailed set of outputs, including more accurate IRR calculations, MOIC, sensitivity and scenario analyses, credit ratios, and covenant compliance. A paper LBO focuses only on the approximations of IRR and return multiples.
  • Computer and Excel: A full LBO will be created using Excel, while a paper LBO will be done manually with a pen and a piece of paper.

While paper LBOs provide rough estimates, full LBO models offer the depth and accuracy necessary for final deal approval.

Why Learning a Paper LBO is Important

Learning how to quickly complete a paper LBO is pretty much a requirement for anyone pursuing a career in private equity (and investment banking). The paper LBO judges job candidates on their ability to think quickly and assess the viability of a deal in a high-stress, time-limited situation.

Successful completion of this task illustrates a solid understanding of LBO mechanics, key financial concepts, and the aptitude to work quickly under pressure. Because of the strict time constraint in completing a paper LBO, it also tests candidates on how quickly they can organize the analysis and use mental math to calculate crucial metrics.

Key Steps of a Paper LBO

When working through a paper LBO exercise, it’s important to remember the most important steps. The three main categories are discussed below:

1. Transaction Assumptions and Details

This category includes all of the important transaction assumptions and financial model assumptions needed to complete the paper LBO prompt.

Transaction assumptions include the following:

a. Purchase price or purchase multiple (typically expressed as an EV/EBITDA multiple). The prompt should also specify the exit multiple, although this is often the same multiple as the purchase (or entry) multiple. There should also be an assumption about when the PE firm will exit the business, typically in five years for paper LBOs, which is what we will assume below.

b. How much debt will be used to purchase the target company (again, typically expressed as a multiple of EBITDA), as well as the interest rate on that debt.

Financial assumptions include the following:

a. Revenues and the projected revenue growth rate.

b. EBITDA margins (EBITDA as a percentage of revenue) and the income tax rate.

c. Depreciation, capital expenditures (CapEx), and net working capital requirements.

2. Financial Model Down to Free Cash Flow

a. Sources and Uses: The sources and uses schedule illustrates where cash will come from (sources) and what the cash will be spent on (uses). The sources and uses accounts should equal each other. This schedule is also necessary to determine the amount of equity the PE firm will need to invest.

b. Income Statement: The candidate will need to complete a simplified income statement in order to properly calculate projected EBITDA and cash flows.

c. Free Cash Flow: The income statement, along with the other financial assumptions listed above, will allow candidates the ability to calculate free cash flow. The free cash flow calculation will impact the cash balance and the ultimate exit equity value. Note that the paper LBO does not include a full balance sheet: only the cash balance and debt balance is necessary for calculating the exit equity value.

d. Debt Balance Schedule: The candidate will likely also need to track the debt balance. In a full LBO, excess cash is used for debt paydown, but a paper LBO will usually simplify this. The debt balance is also important to properly calculate interest expense.

3. Exit Value and Analysis

a. Exit Enterprise Value: Calculated using the final year EBITDA and the exit multiple.

b. Net Debt: The cumulative free cash flow is used to calculate the cash balance and is subtracted from the remaining debt balance to calculate net debt at exit.

c. Exit Equity Value: Calculated as the exit enterprise value minus the net debt.

Example of a Paper LBO Analysis

Let’s now walk through a full paper LBO example, beginning with a prompt that contains the key transaction assumptions and financial model details. Even though the below screenshots are in Excel, this analysis is done with pen and paper only.

Paper LBO Prompt

Given the assumptions below, let’s dive in.

Purchase Price

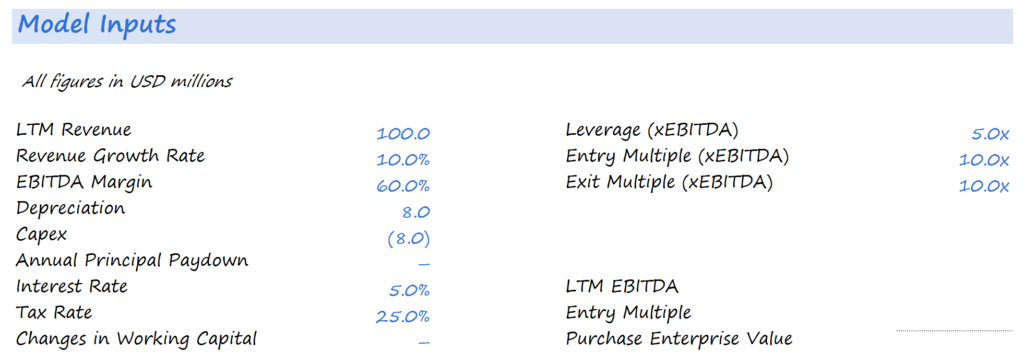
As shown below, the last twelve months (LTM) revenue is $100 million, the revenue growth rate is 10%, and the EBITDA margin is 60%. We’ve also included assumptions for depreciation, CapEx, interest rate, tax rate, and changes in working capital.

Paper LBO

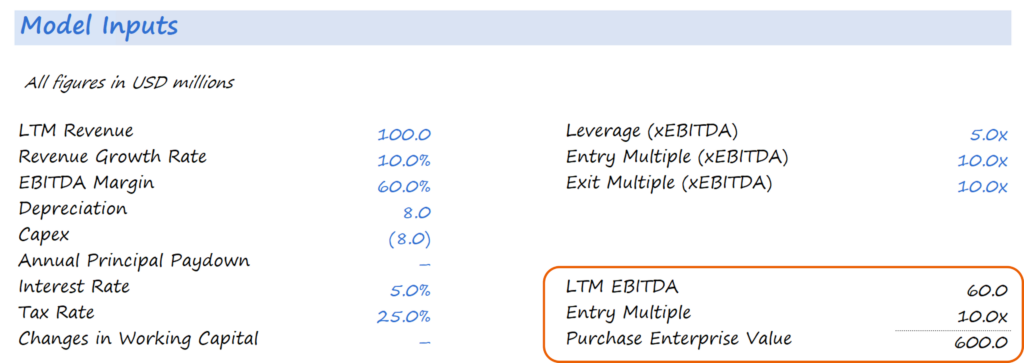
We have everything we need to calculate the purchase price (the purchase enterprise value). Since the LTM revenue is $100 million and the EBITDA margin is 60%, we can calculate the LTM EBITDA as $60 million ($100 million * 60%).

Since we are given the entry multiple of 10x EBITDA, we can then calculate the purchase enterprise value: $600 million (10 * $60 million of EBITDA), as shown below.

The purchase enterprise value is considered the actual purchase price since most acquisitions occur on what’s known as a cash-free, debt-free basis. Basically, a cash-free, debt-free deal assumes the target company has no debt (debt free) and no cash (cash free), which is effectively the same thing as the enterprise value.

Paper LBO - Model Inputs

Sources and Uses

When creating a Sources and Uses schedule, always begin with the uses. In this case the only use will be the purchase enterprise value. In a full LBO, there will be other uses, including transaction-related fees. However, it’s customary to exclude those in a paper LBO.

Paper LBO - Sources & Uses

With uses complete, we can fill in the sources. Based on our financing assumptions above, the private equity firm will be able to raise debt equal to 5x EBITDA, or $300 million (5 * $60 million in EBITDA).

Since sources must equal uses, and we already know the total uses, we then backsolve for the amount of equity financing the PE firm will invest. With total uses of $600 million and $300 million in debt financing, this means the PE firm will need to invest $300 million in equity ($600 million minus $300 million in debt financing). The PE firm’s equity investment is often referred to as sponsor equity, since the PE firm is considered the “sponsor” of the LBO transaction.

It’s also customary to quote the various sources in terms of EBITDA. For example, with a $300 million equity investment, this represents 5x EBITDA ($300 million/$60 million).

Sources & Uses (with Values)

Income Statement

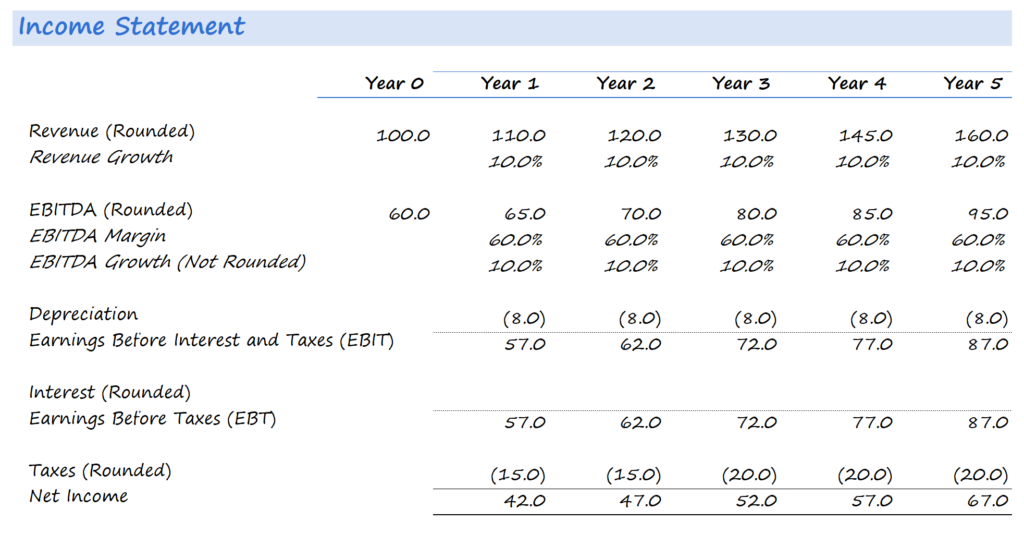
Now, we can move on and complete most of the income statement. As part of the prompt, we were given LTM revenue and the revenue growth rate. We were also given enough information to calculate the projected EBITDA.

We can then deduct depreciation of $8 million to derive EBIT. We could actually go ahead and complete interest expense, but we’ll come back to that later. Even if we leave interest expense blank at this point, we can still calculate everything else including taxes and net income.

Paper LBO - Income Statement

Note that we are rounding revenue, EBITDA, and taxes… we’ll discuss this more later.

Free Cash Flow

Next, we can fill in our cash flow statement or free cash flow calculation.

Paper LBO - Free Cash Flow

We begin with net income and then adjust it for any non-cash expense like depreciation. To derive cash flow, we then deduct out CapEx and factor in changes in working capital. Adding all of that together derives free cash flow. Please note that the above numbers will change when we complete the debt schedule and calculate interest expense.

Debt and Interest Expense

We know the paper LBO model will use $300 million in debt financing at a 5% interest rate. The prompt further assumes there will be no additional debt paydown amount (in comparison, a full LBO would assume excess cash flows would be used to pay down debt in what’s known as a cash sweep).

Debt Schedule

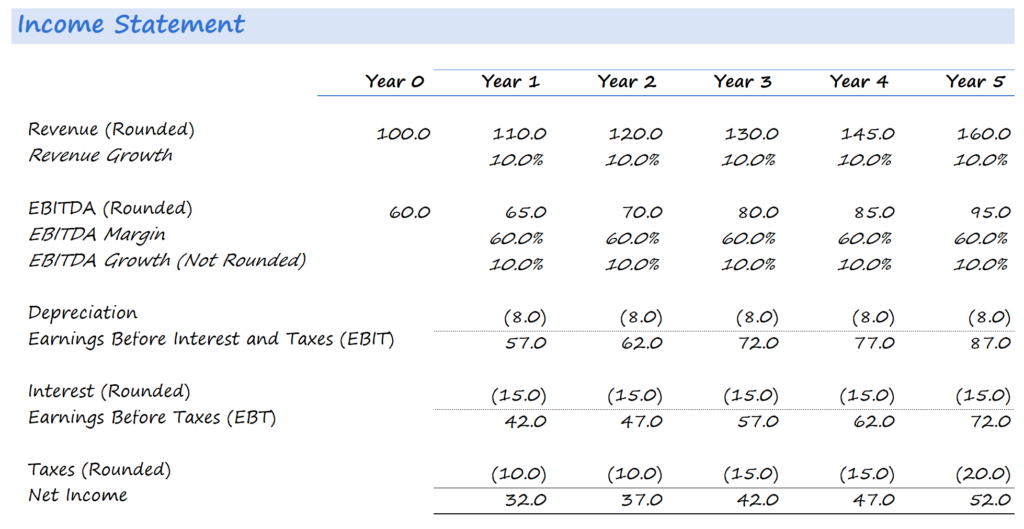
Since the debt balance won’t change over the forecast period, this simplifies the calculation of interest expense. At a 5% interest rate and $300 million in debt, the annual interest expense is $15 million. We can then reference the interest expense back up to the income statement, which will change our net income and cash flows to the figures shown below.

Equity Return

Finally, we can calculate the exit equity value and approximate the multiple of invested capital (MOIC) and the IRR. Since the prompt assumes a five-year exit, we don’t have to calculate the enterprise value, net debt, or equity value for Years 1 through 4, but we’ve gone ahead and done so for reference. Remember, it’s important to simplify this exercise and only calculate numbers you absolutely have to.

Equity Return

In five years, our analysis suggests an $860 million exit equity value. Since the sponsor equity investment was $300 million, this suggests an MOIC of 2.9x ($860 million/$300 million). However, the 2.9x should be rounded to 3.0x in a paper LBO.

The hardest part comes with estimating the IRR that results in a 3.0x MOIC in five years. Fortunately, we can use some mental math to estimate the IRR. Since the investment triples, we can use the Rule of 114 to approximate the IRR. To do so, take 114 and divide by 5, and you get an IRR of roughly 23%, which is really close to what we calculated below. We’ll talk more about this quick math trick momentarily. For the purposes of the paper LBO, you can simply round to 25%.

Tips for Completing a Paper LBO

Below are a few tips to successfully completing a paper LBO prompt:

  • Practice! Practice! Practice! You should be able to complete a paper LBO in less than 10 minutes. Practice different layouts, prompts, and assumptions, since you will encounter different assumptions and layouts compared to what we are showing.
  • Like we discuss in our Financial Modeling Guidelines eBook, start with the end goal in mind before considering the inputs. By starting with the outputs first, we can eliminate unnecessary or unhelpful inputs that would take up time in a high-pressure environment. In the case of a paper LBO, the goal is determining whether the deal makes sense based on the IRR and MOIC. Any calculation that doesn’t contribute to these metrics should not be used.
  • As part of simplifying the model, there are other areas where you can cut down on the number of calculations. For example, assume you are given a prompt with a constant revenue growth rate and a constant EBITDA margin. Mathematically, this means that EBITDA will grow at the revenue growth rate. Therefore, we don’t actually need to calculate revenue, which saves time completing the analysis (unless the revenue is needed to estimate a different metric).
  • Another calculation we could’ve skipped in our above example was with regards to the debt schedule. Since there was no cash sweep, and the debt balance remains constant, we didn’t actually need the full debt schedule, nor did we have to come back to the income statement to complete the interest expense calculation. Bottom line: It’s important to think about what you can skip for time constraints.
  • Always simplify the analysis and use round or approximate numbers when you can. For example, many prompts will give you a revenue (or EBITDA) number, usually rounded to the nearest 50 or 100 (e.g., $150 million or $100 million). The revenue growth rate will also likely be rounded to the nearest 5% or 10%. By using round numbers, you can quickly approximate each year’s revenue. Assuming $100 million in revenue and a 10% growth rate, the below table shows the exact number as well as an approximate number. Just be aware that the further out the analysis goes, the greater the error from the approximation (due to compounding).

  • Ignore model complications like transaction-related fees. As previously mentioned, a uses table will also include fees paid for investment bankers, lawyers, and accountants. These don’t need to be considered in a paper LBO.
  • If you are not explicitly given a forecast or a number for your analysis, you can always ask for more details. However, you might consider making these numbers up yourself and mentioning these assumptions when you complete the analysis. For example, maybe it’s appropriate to assume CapEx equals depreciation or the change in net working capital is zero. Just remember to mention your assumptions and how you came up with those assumptions when discussing the analysis.

Mental Math Tips and Tricks

To successfully and quickly complete a paper LBO, it’s important to be able to perform calculations in your head. We can use “mental math” to estimate things like revenue and EBITDA. We can then use the Rules of 72, 114, and 144 to estimate the MOIC and corresponding IRR.

Estimating Financial Numbers

When calculating financial numbers, we always want to use approximations. A key to that is being able to quickly calculate numbers based on the following increments: 10%, 5%, and 1%, since these are the most important increments for quick calculations.

For example, $100.0 million * 10% = $10.0 million (for 10%, we can shift the decimal one place to the left from $100.0 million to $10.0 million).

For a 5% calculation, we can calculate the 10% number and then divide by two: $100.0 million * 10% = $10.0 million, divide by two to get $5 million.

For a 1% calculation, we can shift the decimal two places to the left: $100.0 million * 1% = $1.0 million.

Estimating IRR

As discussed briefly above, there are a couple of tricks to solving the IRR given a MOIC. We use the following rules:

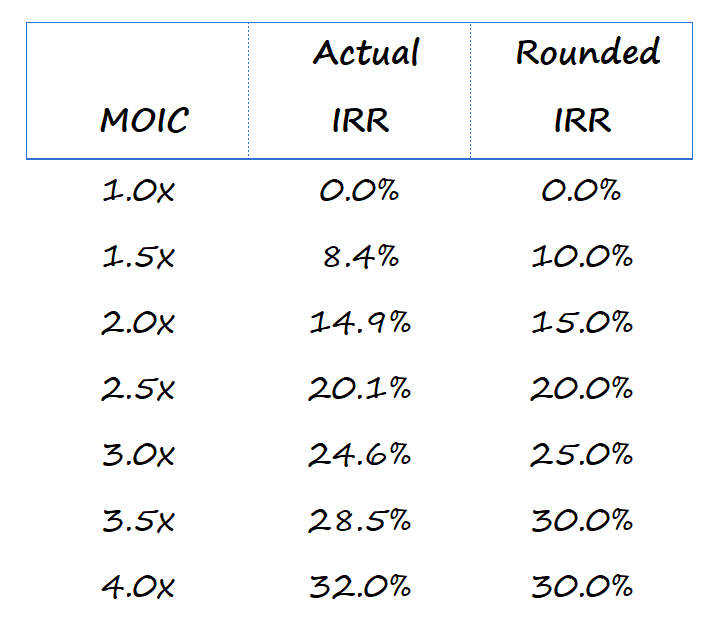
  • For an investment to double, we can use the Rule of 72. If our exit year is in five years and our MOIC is 2x, we can take 72 and divide by five, which returns approximately 14 (or 14%), but we’d round to 15%.
  • If an investment triples (an MOIC of 3x), we use the Rule of 114. With a five-year exit, we take 114 and divide by five, which is approximately 23%, but we’d likely round to 25% for a paper LBO.
  • If an investment quadruples (an MOIC of 4x), we use the Rule of 144. At a five-year exit, take 144 and divide by five, which is approximately 29%, but we’d round it to 30%.

To complete the paper LBO even faster, it might not be a bad idea to memorize numbers from the below tables:

Common Mistakes to Avoid in a Paper LBO

Below are a few common mistakes many applicants make when working on a paper LBO prompt:

  • It’s important to practice a paper LBO early and often, using different numbers and layouts. Ideally, an applicant will have worked through a dozen or more paper LBOs and completed them in 10 minutes or less.
  • Considering this type of analysis can highly stressful, it’s important to remember the end goal is evaluating the deal prospects. Always keep that in mind and stick to the above three-step process.
  • When you’re under pressure, it’s easy to accidentally overcomplicate things, which will slow you down and potentially result in an incorrect analysis. Therefore, you should always eliminate and simplify calculations where possible and commit many of the math tricks to memory.

Additional Resources

Thank you for reading CFI’s guide on Paper LBOs. To keep advancing your career and skills, the following CFI resources will be useful:

LBO Model

CFI’s LBO Modeling course

Private Equity Career

See all career resources

See all valuation resources

0 search results for ‘