Get Certified for Financial Modeling (FMVA)®
Gain in-demand industry knowledge and hands-on practice that will help you stand out from the competition and become a world-class financial analyst.
Comparing the LTM and NTM methods of valuation
Financial analysts use Last Twelve Months (LTM) or Next Twelve Months (NTM) and a number of different valuation multiples when evaluating corporate deals. In the world of M&A, relative valuation is one of the fastest methods for valuing a business.
However, it becomes very important to understand the metric being used, as the objective is always to compare the companies with a similar data point to avoid inconsistencies in the result.
LTM stands for Last Twelve Months and TTM stands for Trailing Twelve Months, which is basically the historic or backward-looking multiple. It uses data points like EPS, EBITDA, revenue, etc., of the last twelve months of operation. The reason for using past period data is that it is based on actual results and, hence, more reliable. LTM is generally used for businesses with uniform growth prospects.
However, when the company’s performance is cyclical in nature or is driven by technological savvy, growth prospects differ. In such a case, valuations based on historical multiples may not represent the potential value of a business. As a result, NTM, or Next Twelve Months, and other forward multiples make more sense, as they provide a picture of what the company is projecting to achieve.
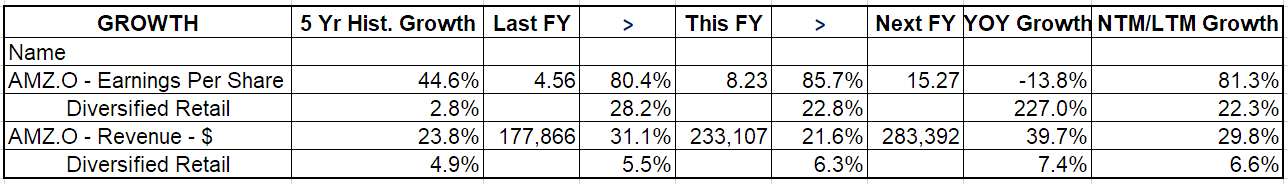
The captured data for Amazon below shows how the performance of its EPS changes from 80.4% last year to the expected performance of 85.7% in NTM. A similar forecast can be seen for the company’s revenue.
The multiples below show how the difference between the multiples can be based on historical and future projections. Below is the LTM and NTM multiples of Amazon.
| FORECAST MULTIPLES (MEAN) | ||
|---|---|---|
| LTM | NTM | |
| EV/Revenue | 3.7 | 2.73 |
| EV/EBITDA | 42.26 | 23.42 |
| EV/EBIT | 160.35 | 94 |
| PE | 217.19 | 142.4 |
| PEG | 8.38 | 2.21 |
| Dividend Yield | 0 | 0 |
| FCF Yield | 0.39 | 2.18 |
| Price/Sales | 3.63 | 2.68 |
| Price/Cashflow | 35.02 | 23.8 |
| Price/Book Value | 23.4 | 17.3 |
| Return on Assets | 2.83 | 4.41 |
| Return on Equity | 12.91 | 18.2 |
| Return on Invested Capital | 11.69 | 17.22 |
EV/Revenue is one of the more popular multiples used across industries, as it is difficult to manipulate the denominator. The EV/Revenue multiple becomes even more relevant when a company has low or negative earnings, such as in early-stage growth companies who aren’t generating much profit.
However, one must be aware that using EV/Revenue multiples will not take into consideration the large differences in the way comparable companies are operated, which reflects in their EBITDA.
EV/EBITDA is one of the most commonly used multiples and it acts as a proxy for free cash flows (before capital expenditures). Learn more about EBITDA.
EBIT (also called Operating Income) is derived after the adjustment of depreciation and amortization, as it reflects real expenses and considers wear and tear of a firm’s assets that need to be replaced by the company.
In the case of non-capital-intensive companies, such as consulting or technology companies, EBITDA and EBIT are somewhat close, and hence multiples like EV/EBITDA and EV/EBIT are similar.
This is not one of the very popular ways to calculate multiples, but it is still used by capital-intensive companies. The invested capital determines the potential earnings; however, it does not take into account differences in profitability. Learn more about calculating the Return on Capital Employed (ROCE).
The P/E multiple takes into consideration the price in the numerator and earnings per share in the denominator. It is similar to equity value to net income, wherein they are divided by fully diluted shares.
The PEG ratio is simply the P/E ratio divided by the EPS growth rate. The multiple considers the growth prospects of the company while capturing its growth rate. A company in the growth stage will realize more value than the company that already reached the maturity stage.
Thank you for reading CFI’s guide to LTM vs. NTM. To keep learning and advancing your career, the following resources will be helpful:


