Comparable company analysis (or “comps” for short) is a valuation methodologyValuation MethodsWhen valuing a company as a going concern there are three main valuation methods used: DCF analysis, comparable companies, and precedent that looks at ratios of similar public companies and uses them to derive the value of another business. Comps is a relative form of valuation, unlike a discounted cash flow (DCF) analysis, which is an intrinsic form of valuationIntrinsic ValueThe intrinsic value of a business (or any investment security) is the present value of all expected future cash flows, discounted at the appropriate discount rate. Unlike relative forms of valuation that look at comparable companies, intrinsic valuation looks only at the inherent value of a business on its own..
In this guide, we will break down all the steps necessary to perform comparable company analysis, as required in most financial analyst jobs.
Steps in performing comparable company analysis
In the next section of this guide, we will go through a detailed list of how to build your own comps table. This type of work will be routine for anyone working as an analyst in investment bankingJobsBrowse job descriptions: requirements and skills for job postings in investment banking, equity research, treasury, FP&A, corporate finance, accounting and other areas of finance. These job descriptions have been compiled by taking the most common lists of skills, requirement, education, experience and other, equity research, corporate development, or private equity.
#1 Find the right comparable companies
This is the first and probably the hardest (or most subjective) step in performing ratio analysis of public companies. The very first thing an analyst should do is look up the company you are trying to value on CapIQ or BloombergBloomberg Functions ListList of the most common Bloomberg functions and shortcuts for equity, fixed income, news, financials, company information. In investment banking, equity research, capital markets you have to learn how to use Bloomberg Terminal to get financial information, share prices, transactions, etc. Bloomberg functions list so you can get a detailed description and industry classification of the business.
The next step is to search either of those databases for companies that operate in the same industry and that have similar characteristics. The closer the match, the better.
The analyst will run a screen based on criteria that include:
Once you’ve found the list of companies that you feel are most relevant to the company you’re trying to value it’s time to gather their financial information.
Once again, you will probably be working with Bloomberg TerminalFinancial DataWhere to find data for financial analysts - Bloomberg, CapitalIQ, PitchBook, EDGAR, SEDAR and more sources of financial data for financial analysts online or Capital IQCapIQCapIQ (short for Capital IQ) is a market intelligence platform designed by Standard & Poor’s (S&P). The platform is widely used in many areas of corporate finance, including investment banking, equity research, asset management and more. The Capital IQ platform provides research, data, and analysis on private, public and you can easily use either of them to import financial information directly into Excel.
The information you need will vary widely by industry and the company’s stage in the business lifecycle. For mature businesses, you will look at metrics like EBITDA and EPS, but for earlier stage companies you may look at Gross Profit or Revenue.
If you don’t have access to an expensive tool like Bloomberg or Capital IQ you can manually gather this information from annual and quarterly reports, but it will be much more time-consuming.
Learn more: list of Bloomberg functionsBloomberg Functions ListList of the most common Bloomberg functions and shortcuts for equity, fixed income, news, financials, company information. In investment banking, equity research, capital markets you have to learn how to use Bloomberg Terminal to get financial information, share prices, transactions, etc. Bloomberg functions list.
#3 Setup the comps table
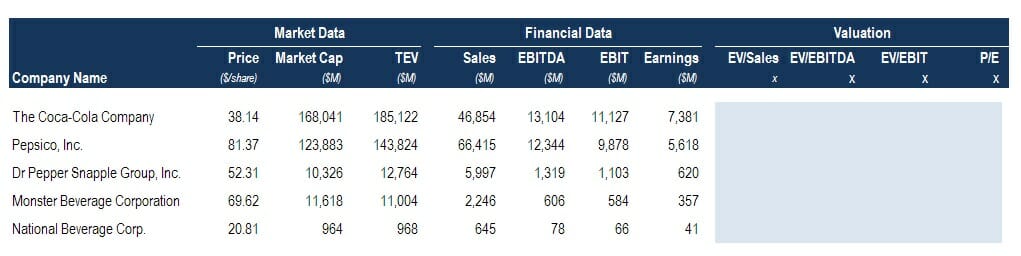
In Excel, you now need to create a table that lists all the relevant information about the companies you’re going to analyze.
The main information in comparable company analysis includes:
Company name
Share price
Market capitalizationMarket CapitalizationMarket Capitalization (Market Cap) is the most recent market value of a company’s outstanding shares. Market Cap is equal to the current share price multiplied by the number of shares outstanding. The investing community often uses the market capitalization value to rank companies
Net debtNet DebtNet debt = total debt - cash. Net debt is a financial liquidity metric that measures a company’s ability to pay all its debts if they were due today. Compares a company’s total debt with its liquid assets.
Enterprise valueEnterprise Value (EV)Enterprise Value, or Firm Value, is the entire value of a firm equal to its equity value, plus net debt, plus any minority interest, used in
RevenueLTM RevenueLTM stands for “Last Twelve Months” and is similar in meaning to TTM, or “Trailing Twelve Months.” LTM Revenue is a popular term used in the world of finance as a measurement of a company’s financial health. It reports or calculates the revenue figures for the "past 12 months."
EBITDAEBITDAEBITDA or Earnings Before Interest, Tax, Depreciation, Amortization is a company's profits before any of these net deductions are made. EBITDA focuses on the operating decisions of a business because it looks at the business’ profitability from core operations before the impact of capital structure. Formula, examples
EPSEarnings Per Share (EPS)Earnings per share (EPS) is a key metric used to determine the common shareholder's portion of the company’s profit. EPS measures each common share's profit
Analyst estimatesIBES EstimatesIBES (also known as I/B/E/S) stands for Institutional Broker’s Estimate System, a database that was created by the Lynch, Jones, and Ryan brokerage. This system basically compiles the analysis and forecasted future earnings of publicly traded companies. With the help of this database, users can see the different predictions, along with the forecasts of analysts.
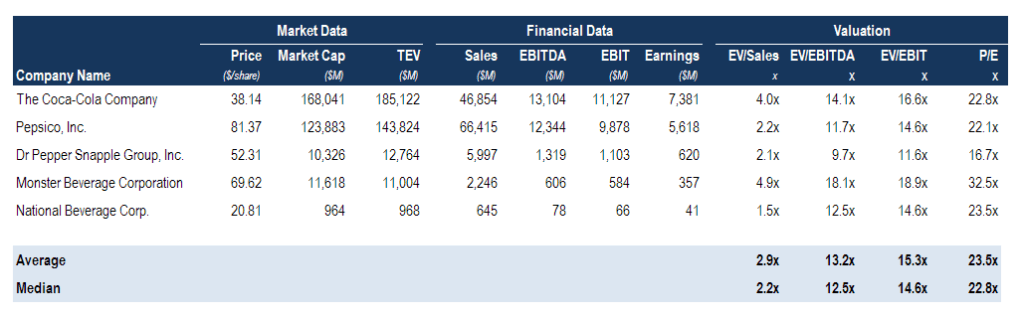
The above information can be organized as shown in our example comparable companies analysis shown below.
With a combination of historical financials and analyst estimates populated in the comps table, it’s time to start calculating the various ratios that will be used to value the company in question.
The main ratios included in a comparable company analysis are:
EV/RevenueEnterprise Value to Revenue MultipleThe Enterprise Value (EV) to Revenue multiple is a valuation metric used to value a business by dividing its enterprise value (equity plus
EV/Gross Profit
EV/EBITDAEV/EBITDAEV/EBITDA is used in valuation to compare the value of similar businesses by evaluating their Enterprise Value (EV) to EBITDA multiple relative to an average. In this guide, we will break down the EV/EBTIDA multiple into its various components, and walk you through how to calculate it step by step
P/EPrice Earnings RatioThe Price Earnings Ratio (P/E Ratio) is the relationship between a company’s stock price and earnings per share. It gives investors a better sense of the value of a company. The P/E shows the expectations of the market and is the price you must pay per unit of current (or future) earnings
P/NAV
P/BMarket to Book RatioThe Market to Book ratio, or Price to Book ratio, is used to compare the current market value or price of a business to its book value of equity on the balance sheet. Market value is the current stock price times all outstanding shares, net book value is all assets minus all liabilities. The ratio tells us how much
Download the Free Template
Enter your name and email in the form below and download the free template now!
#5 Use the multiples from the comparable companies to value the company in question
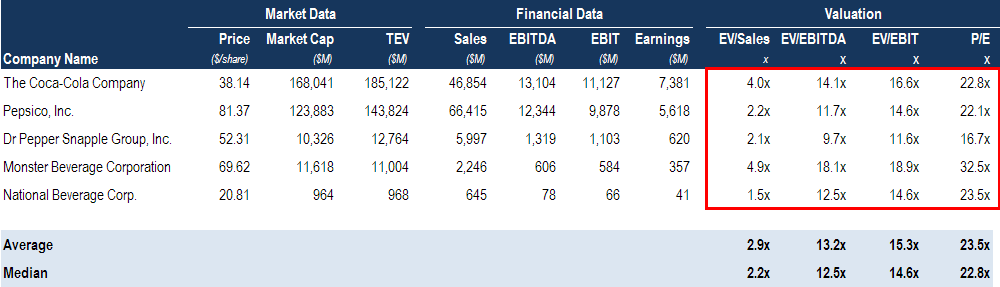
Analysts will typically take the average or median of the comparable companies’ multiples and then apply them to the revenue, gross profit, EBITDA, net income, or whatever metrics they included in the comps table.
In order to come up with a meaningful average, they often remove or exclude outliers and continually massage the numbers until they seem relevant and realistic.
For example, if the average P/E ratio of the group of comparable companies is 12.5 times, then the analyst will multiply the earnings of the company they are trying to value by 12.5 times to arrive at their equity value.
Formatting the table
For a good financial analystThe Analyst Trifecta® GuideThe ultimate guide on how to be a world-class financial analyst. Do you want to be a world-class financial analyst? Are you looking to follow industry-leading best practices and stand out from the crowd? Our process, called The Analyst Trifecta® consists of analytics, presentation & soft skills, formatting matters a lot! In the tables shown above, you can see what type of formatting is recommended.
It’s important to clearly separate market data, financial data, and the multiples into separate sections, so the reader can easily follow the information.
Multiples should have an “x” next to them (which we explain how to do in our free Excel Crash Course) and should be to one decimal place.
The average or median section should be clearly separated at the bottom of the table and indicate if any adjustments have been made.
Interpreting the results
Once the numbers are complete and the comps table is finalized, it’s time to start interpreting the results. One way to use the information is to look for companies that are overvalued or undervalued. Comps can help you uncover the opportunities, but the results need to be interpreted carefully as they don’t include any qualitative factors whatsoever.
To properly evaluate the numbers in the comps table you have to understand why numbers are what they are. Why does Company A trade at a discounted EV/EBITDA multiple to Company B?
Is it because it’s undervalued and a good buying opportunity?
Or, is it because it has a much lower growth rate and requires more CapEx spending?
Even though Company A trades at a lower multiple, it might actually be “more expensive” than Company B!
This is where the art of being a great financial analyst comes into play.
Applications of comparable company analysis
There are many uses for comps (or comparable companies analysis, or market multiples, or whatever name you use for them). Typically performed by financial analysts and associates, the most common uses include:
Initial Public Offerings (IPOs)Initial Public Offering (IPO)An Initial Public Offering (IPO) is the first sale of stocks issued by a company to the public. Prior to an IPO, a company is considered a private company, usually with a small number of investors (founders, friends, family, and business investors such as venture capitalists or angel investors). Learn what an IPO is
Follow-on offerings
M&A advisoryMergers Acquisitions M&A ProcessThis guide takes you through all the steps in the M&A process. Learn how mergers and acquisitions and deals are completed. In this guide, we'll outline the acquisition process from start to finish, the various types of acquirers (strategic vs. financial buys), the importance of synergies, and transaction costs
Fairness opinionsFairness OpinionA fairness opinion is a report compiled by a qualified investment banker or advisor that evaluates the fairness of the price offered during an acquisition, takeover, or merger. The opinion relates to the price offered by the buyer and the fairness of the terms to the company's shareholders.
Restructuring
Share buybacks
Terminal Value in a DCF modelKnowledgeCFI self-study guides are a great way to improve technical knowledge of finance, accounting, financial modeling, valuation, trading, economics, and more.
Multiples and financial modeling
Multiples pay a significant role in financial modelingWhat is Financial ModelingFinancial modeling is performed in Excel to forecast a company's financial performance. Overview of what is financial modeling, how & why to build a model.. They are commonly used as the terminal value assumption in a Discounted Cash Flow (DCF) model, with the most common assumption being an EV/EBTIDA multiple based on currently observable prices in the market.
Multiples can also be used to tie the results of the financial model back to reality. If the result that comes out of the financial model implies a 30x EV/EBITDA multiple, and none of the comps are currently trading about 12x, the model may require some adjusting.
For more on the art of financial modeling, please check out CFI’s wide range of financial modeling courses.
More resources from CFI
CFI is the official provider of the Financial Modeling and Valuation Analyst (FMVA)™ certificationFMVA® CertificationJoin 350,600+ students who work for companies like Amazon, J.P. Morgan, and Ferrari , developed to turn anyone into a world-class financial analyst.
At CFI we’re on a mission to help you advance your career. Some of our most popular free resources include:
Valuation methods guideValuation MethodsWhen valuing a company as a going concern there are three main valuation methods used: DCF analysis, comparable companies, and precedent
DCF modeling guideDCF Model Training Free GuideA DCF model is a specific type of financial model used to value a business. The model is simply a forecast of a company’s unlevered free cash flow
How to be a great financial analystThe Analyst Trifecta® GuideThe ultimate guide on how to be a world-class financial analyst. Do you want to be a world-class financial analyst? Are you looking to follow industry-leading best practices and stand out from the crowd? Our process, called The Analyst Trifecta® consists of analytics, presentation & soft skills
Financial modeling best practicesFree Financial Modeling GuideThis financial modeling guide covers Excel tips and best practices on assumptions, drivers, forecasting, linking the three statements, DCF analysis, more