Learn Microsoft Excel: Corporate Training & Finance Certification

What's Available
World-class courses
Consisting of over 1200+ lessons
70+ interactive exercises
Learn by doing with guided simulations
Expert instructors
Learn from the very best
New courses monthly
On need-to-know subject matter
Blockchain certificate
To verify your skills
500,000+ 5-star ratings
Best-in-class training, as rated by you
Start Your Excel Learning Path
Top Excel Courses
Browse all coursesWhy Learn Excel with CFI?
As one of the leading providers of online finance certification programs, CFI helps current and aspiring finance professionals reach their career goals. All of our Excel courses are designed by professional trainers with decades of experience training Excel at global financial institutions.
We offer comprehensive finance education that combines theory with application to build real-world skills for a future in finance. All programs are online and self-paced, so you can learn in your free time and develop your skill set anytime, from anywhere.
Over 75% of CFI learners report improved productivity or competency within weeks.


With our Excel training, you'll learn how to:
Who is online Excel training for?

Investment professionals

Management consultants

Financial analysts
Registered Provider: National Association of State Boards of Accountancy
All courses are accredited by the Better Business Bureau (BBB), CPA Institutions in Canada, and the National Association of State Boards of Accountancy (NASBA) in the US. Most courses qualify for verified CPE credits for CPA charterholders.
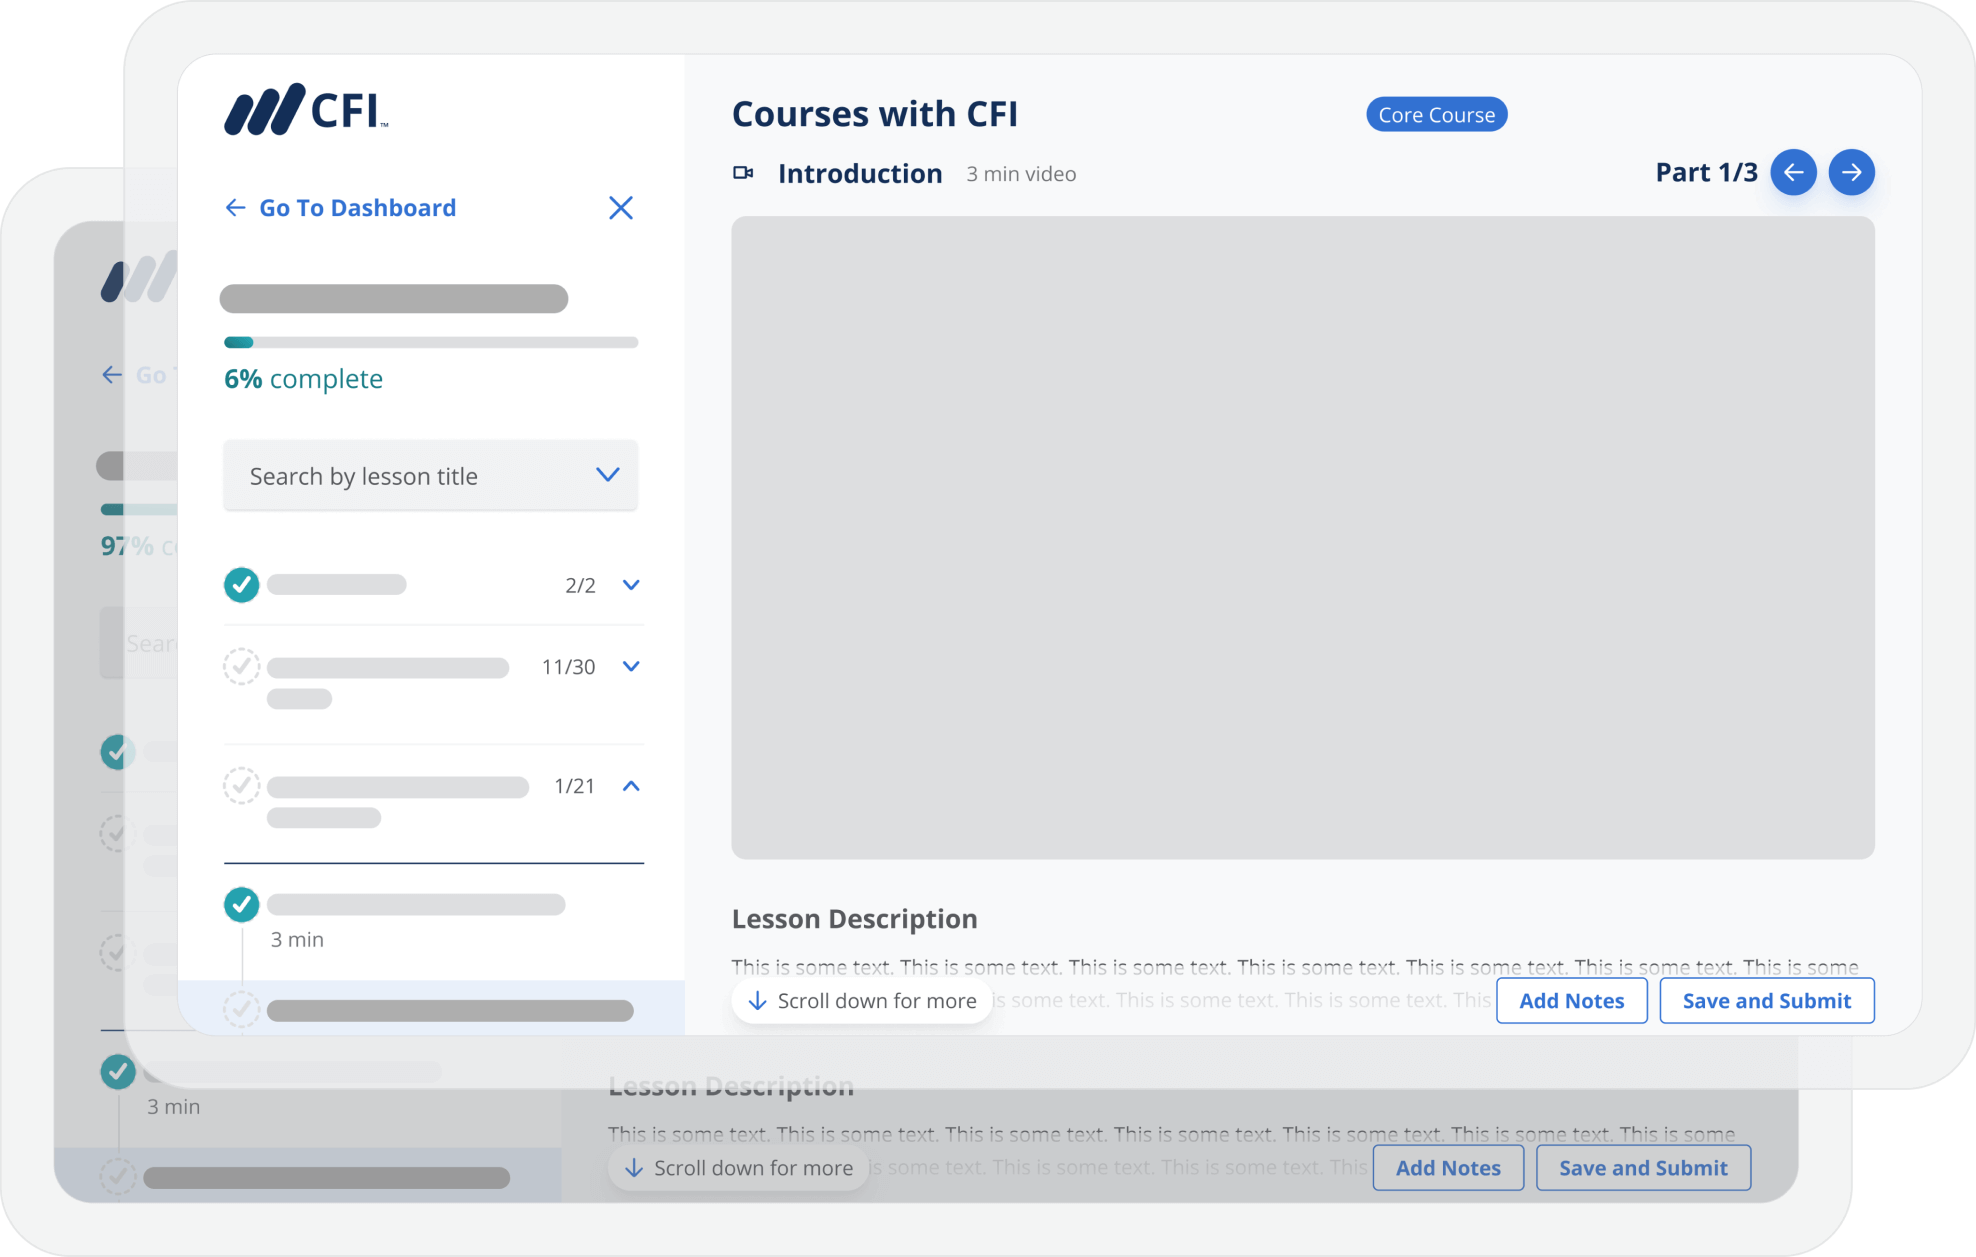
Courses include video lessons, templates, quizzes, and final assessments.


