Get Certified for Financial Modeling (FMVA)®
Gain in-demand industry knowledge and hands-on practice that will help you stand out from the competition and become a world-class financial analyst.
Corporate Finance Ratios are quantitative measures that are used to assess businesses. These ratios are used by financial analysts, equity research analysts, investors, and asset managers to evaluate the overall financial health of businesses, with the end goal of making better investment decisions. Corporate Finance Ratios are also heavily used by financial managers and C-suite officers to get a better understanding of how their business is performing.
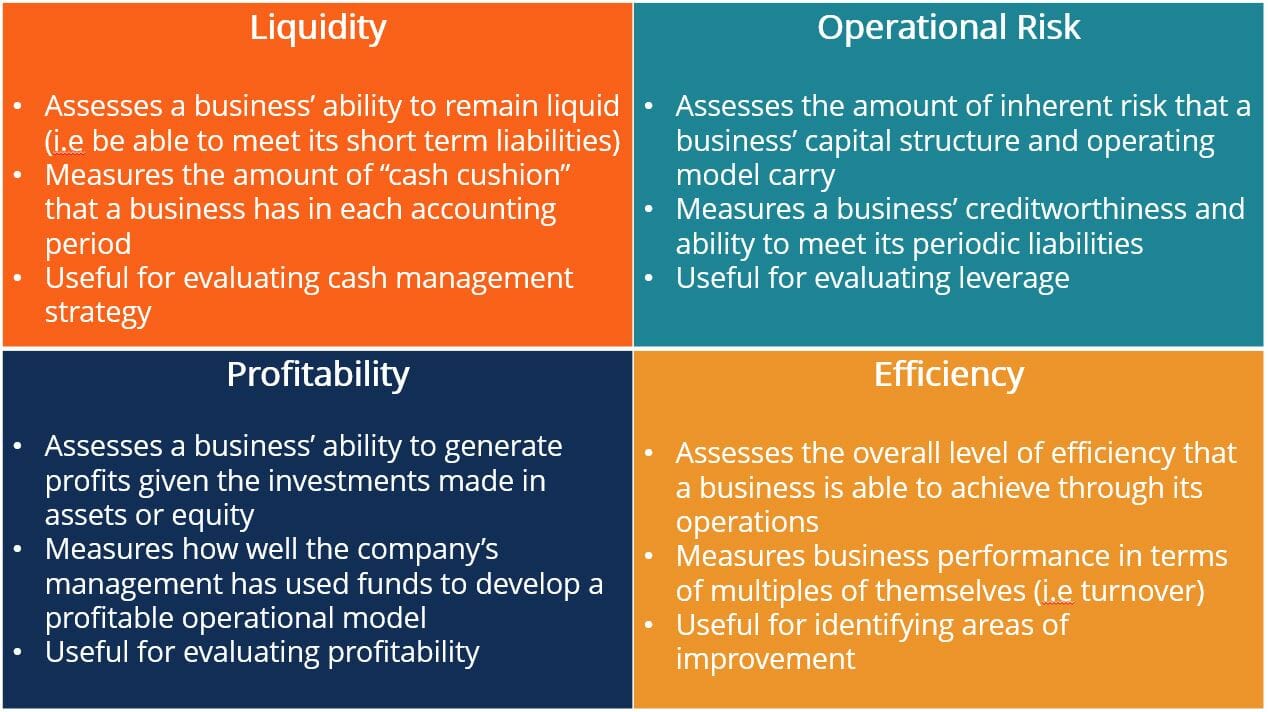
Corporate Finance Ratios can be broken down into four categories that measure different types of financial metrics for a business: Liquidity ratios, Operational Risk ratios, Profitability ratios, and Efficiency Ratios. The differences between these categories are explained in the following graphic:
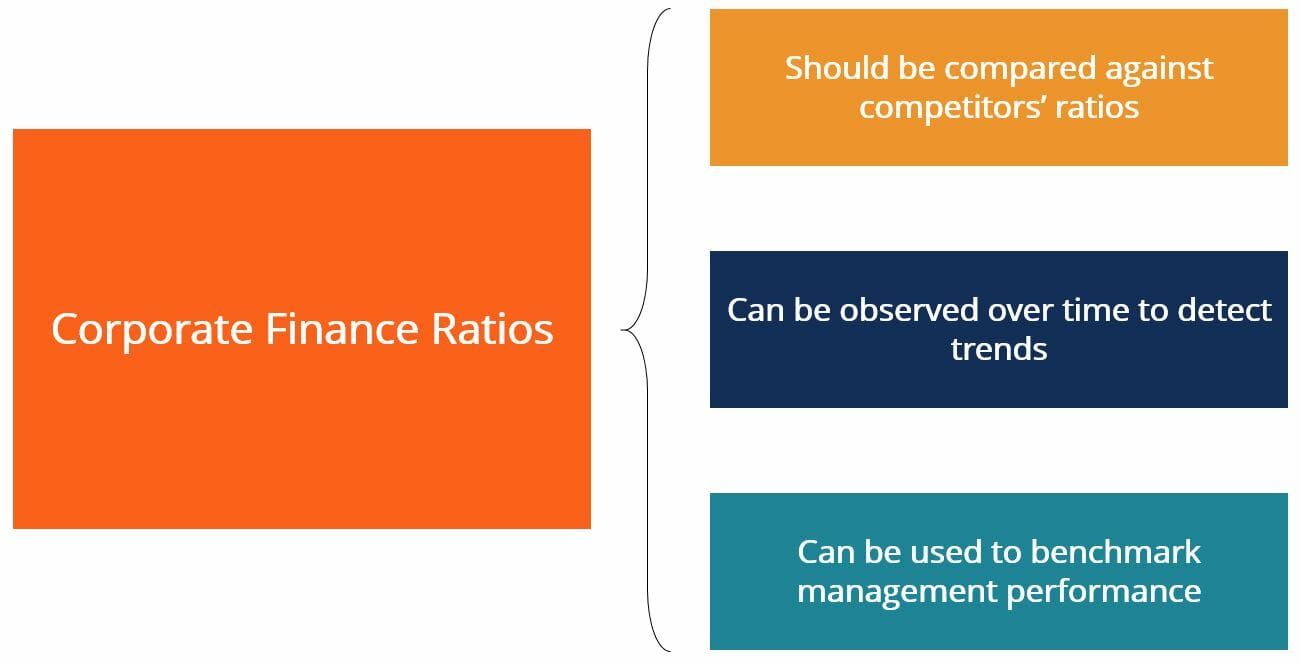
Corporate Finance Ratios enable analysts, management, and investors to assess the financial performance of a company by ranking them against time-series data, competitor ratios, or performance targets.
Ratios are not very meaningful by themselves. To draw better insights from them, we should calculate the same ratios for a number of different companies that operate within the same industry (i.e., competitors). This will enable us to better understand how well a company is performing within the context of the industry. Ratios can also be computed at various periods in time in order to see how they have evolved over time. This can be done for an individual company, or for a number of companies operating in the same industry in order to observe how specific metrics have changed.
Lastly, ratios can be used to benchmark the performance of a company’s management team against targets that were set out earlier. Some companies compensate their management teams when certain specific ratio targets are achieved. For example, a CEO may receive a special bonus if, under his tenure, the company is able to increase its return on equity by 10%.
| CAPEX to Operating Cash Ratio | Measuring how much of a company’s operating cash flow is funnelled into capital expenditure projects | Cash Flow from Operations / CAPEX |
 |
| Cash Ratio | A liquidity ratio that measures a company’s ability to pay off short-term liabilities with highly liquid assets | Cash and Cash Equivalents / Current Liabilities |
 |
| Current Ratio | Measures a business' ability to meet its obligations that are due in less than 1 year | Current Assets / Current Liabilities |
 |
| Defensive Interval Ratio | Compares a business' current assets to its daily cash expenditures | Current Assets / Daily Expenditures |
 |
| Operating Cash Flow Ratio | Evaluates a business' ability to pay off short term liabilities using the cash flow from operations | Cash Flow from Operations / Current Liabilities |
 |
| Quick Ratio | Do the company’s current assets easily cover its current liabilities? | (Cash & Equivalents + Marketable Securities + Accounts Receivable) / Current liabilities |
 |
| Times Interest Earned (Cash Basis) Ratio | Evaluating a company's ability to meet its debt obligations with cash | Adjusted Operating Cash Flow / Interest Expense |
 |
| Asset Coverage Ratio | Measures a business' abiliy to cover debt obligations with assets | [(Total Assets - Intangible Assets) - (Current Liabilities - Short Term Debt)] / Interest Expense |
 |
| Cash Coverage Ratio | Measures a business' abiliy to cover debt obligations with cash | Total Cash / Interest Expense |
 |
| Cash Flow to Debt Ratio | Calculates the percentage of debt that could be paid off using cash generated from operations | Cash Flow from Operations / Total Business Debt |
 |
| Debt Service Coverage Ratio | Evaluates a company’s ability to use its operating income to repay its debt obligations (including interest) | Operating Income / Total Debt Service |
 |
| Debt to Assets Ratio | Envisioning a company's debt load in relation to its assets | Total Debt / Total Assets |
 |
| Interest Coverage Ratio | Measures a business' abiliy to cover debt obligations with operating income | Operating Income / Interest Expense |
 |
| Times Interest Earned Ratio | Calculates how many times over a company could pay its interest expenses with its earnings before interest and taxes | EBIT / Interest Expense |
 |
| Gross Margin Ratio | Calculates the percentage of revenues that are left over after COGS | (Revenue - COGS) / Revenue |
 |
| Net Profit Margin | Calculates the percentage of revenues that are left over after all expenses and taxes | Net Profit / Revenue |
 |
| Operating Margin | Calculates the percentage of revenues that are left over after all expenses | Operating Income / Revenue |
 |
| Pretax Margin Ratio | Displays Earnings Before Taxes (EBT) relative to revenues | EBT / Revenue |
 |
| Return on Assets (ROA) | Quantifies how much profit the business has generated given its available assets | Net Income / Average Assets |
 |
| Return on Equity (ROE) | Quantifies how much profit the business has generated given its available equity financing | Net Income / Shareholder's Equity |
 |
| Return on Investment (ROI) | Represents a general return figure that investors can utilize to quantify investment performance | Change in Value of Investment / Investment Cost |
 |
| Accounts Payable Turnover Ratio | Expresses credit purchases as a multiple of accounts payable | Net Credit Purchases / Average Accounts Payable |
 |
| Accounts Receivable Turnover Ratio | Expresses credit sales as a multiple of accounts receivable | Net Credit Sales / Average Accounts Receivable |
 |
| Asset Turnover Ratio | Expresses net sales as a multiple of the company's total assets | Net Sales / Average Total Assets |
 |
| Contribution Margin Ratio | Shows the percentage of earnings retained after variable costs | (Total Revenue - Variable Costs) / Total Revenue |
 |
| Employee Turnover | Shows the percentage of employees that have left the company (voluntarily or involuntarily) | Number of Employees Separated / Average Number of Employees |
 |
| Fixed Asset Turnover | Expresses net sales as a multiple of the company's fixed assets | Net Sales / Average Fixed Assets |
 |
| Inventory Turnover | Expresses COGS as a multiple of the company's average inventory | COGS / Average Inventory |
 |
Connect what you just learned to a clear career path with CFI’s role‑based courses and certification programs.
Thank you for reading this article on Corporate Finance Ratios! CFI offers the Financial Modeling & Valuation Analyst (FMVA)™ certification program for those looking to take their careers to the next level. To learn more about related topics, check out the following CFI resources:


