Get Certified for Financial Modeling (FMVA)®
Gain in-demand industry knowledge and hands-on practice that will help you stand out from the competition and become a world-class financial analyst.
Most common questions (and answers) asked in a financial modeling interview
In this Financial Modeling Interview guide, we’ve compiled a list of the most common and frequently asked financial modeling interview questions. This guide is perfect for anyone interviewing for a financial analyst job or any other role requiring knowledge in the field, as it helps you prepare for the most critical questions relating to financial modeling concepts and applications.
Alongside this comprehensive guide to financial modeling interview questions (and answers), you may also be interested in exploring “The Analyst Trifecta“ — CFI’s guide on how to be a great financial analyst.
This guide focuses exclusively on technical financial modeling interview questions, especially the fundamental knowledge of building financial models using software such as Excel.
General best practices for finance or financial modeling interview questions include:
A financial model is simply a tool that’s usually built in Excel to forecast or project a business’ financial performance into the future. The forecast is typically based on the company’s historical performance and requires preparing an income statement, balance sheet, cash flow statement, and supporting schedules (known as a “three statement model”). From there, more advanced types of models can be built, such as discounted cash flow analysis (DCF model), leveraged-buyout, mergers and acquisitions, and sensitivity analysis.
The output of a financial model is used for decision-making and performing financial analysis, whether inside or outside of the company. Inside a company, executives use financial models to make decisions about:
There are 10 major steps involved in building a financial model:
#1 Historical results and assumptions
Building a financial model begins with collecting information from financial statements for the past three years or more and calculating items such as revenue growth rate, gross margins, accounts payable days, inventory days, and accounts receivable days. These metrics are then used in combination with the financial analyst’s insights to lay out the assumptions for the forecast period as hard codes.
#2 Construct the income statement
With the forecast assumptions in place, you can build the income statement, starting from revenue and COGS all the way down to EBITDA.
#3 Construct the balance sheet
The balance sheet is the next thing to build. Using assumptions such as AR days, AP days, and inventory days, balance sheet items like accounts receivable and inventory can be forecast into the future.
#4 Build the supporting schedules
Before completing the income statement and balance sheet, you need to create a schedule for capital assets such as Property, Plant & Equipment (PP&E) as well as for debt and interest.
#5 Complete the I/S and B/S
On the income statement, link depreciation to the PP&E schedule and interest to the debt schedule. You can then finish up the income statement by calculating the earnings before taxes, taxes, and net income. On the balance sheet, link the closing PP&E balance and closing debt balance from the supporting schedules. Shareholder’s equity is computed by adding net income and capital raised and subtracting dividends or shares repurchased from last year’s closing balance.
#6 Construct the cash flow statement
Upon completing the income statement and balance sheet, you can build the cash flow statement using the reconciliation method. Operating cash flow is calculated by taking net income, adding depreciation, and adjusting for changes in non-cash working capital. Investing cash flow is a function of capital expenditures in the PP&E schedule, and financing cash flow consists of all cash inflows and outflows due to changes in debt and equity.
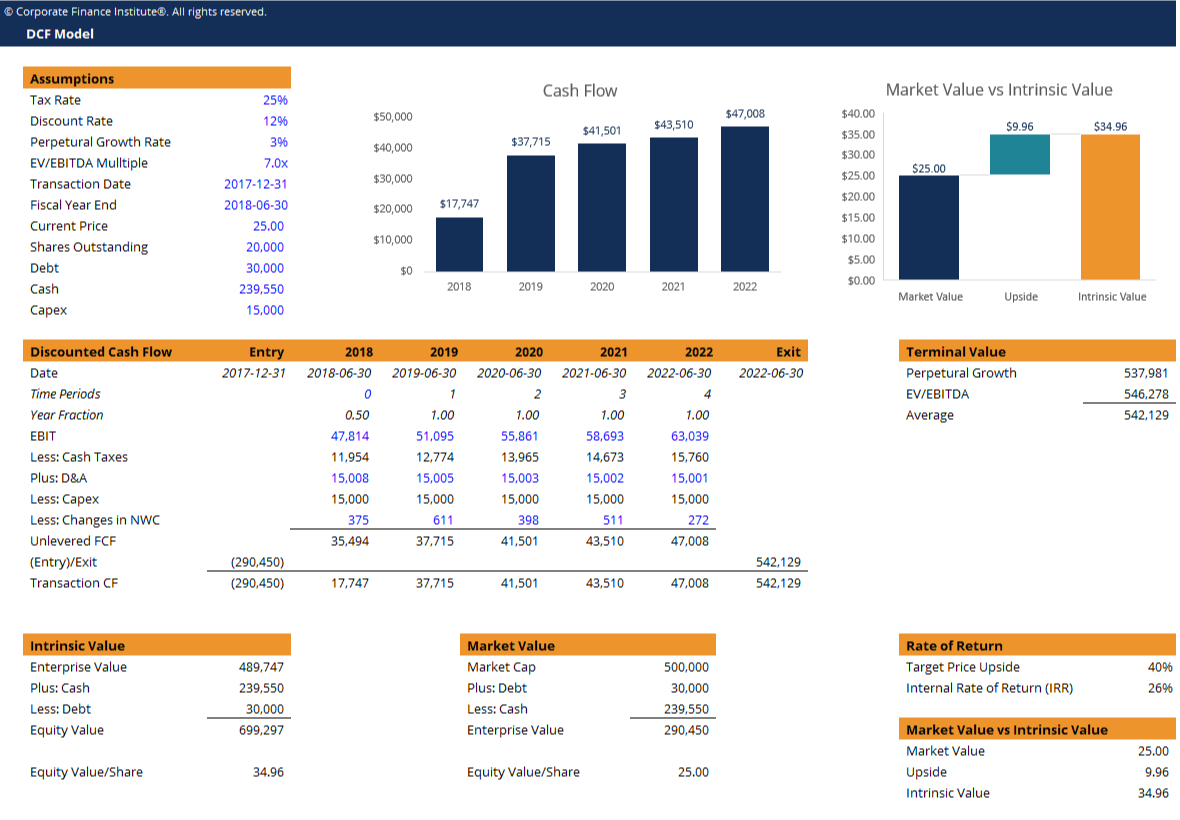
#7 Perform the DCF analysis
Discounted Cash Flow (DCF) analysis is a method of business valuation. It is done by calculating the free cash flows and discounting them back to today at the firm’s cost of capital (or required rate of return). You can then compute the net present value (NPV) of the firm.
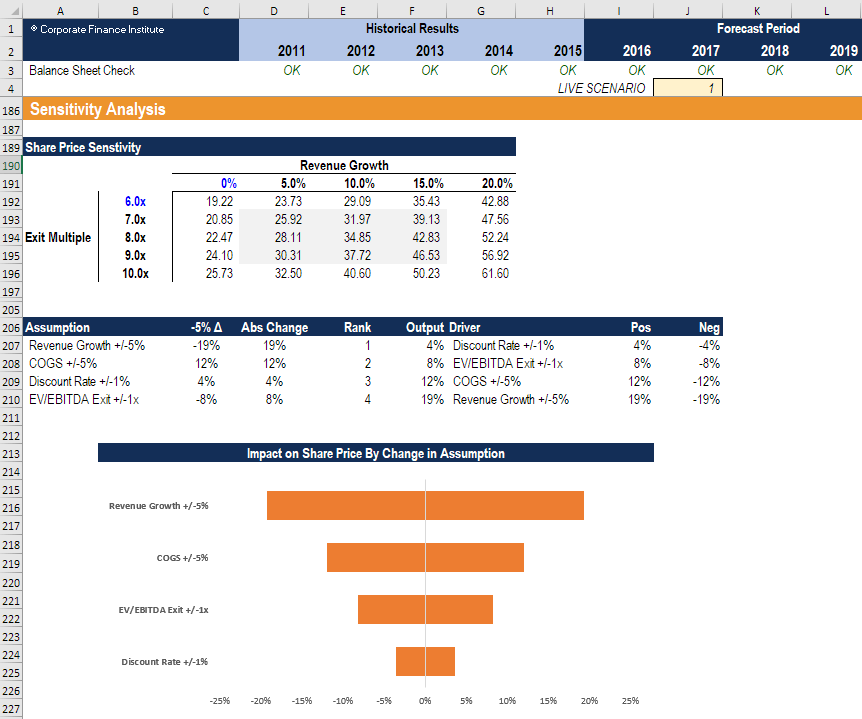
#8 Sensitivity analysis and scenarios
Once the DCF analysis is completed, you can incorporate sensitivity analysis and scenarios to assess the impact on the value of the company that results from changing different variables. These are good ways to assess the risk of an investment.
#9 Build charts and graphs
Presenting results of financial analysis using visual components such as charts and graphs helps executives and management better interpret financial results and identify trends quickly.
#10 Stress test and audit
It is important to stress test extreme scenarios to see if the financial model behaves as expected. Financial analysts should also audit the model using tools in Excel.
By following industry best practices in financial modeling, financial analysts can build financial models more efficiently, and users are able to easily and quickly grasp important information when they look at the models.
#1 Excel tips and tricks
#2 Formatting
Clearly distinguish between inputs (assumptions) and outputs (calculations or formulas) using formatting conventions — blue font for inputs and black font for formulas, shading, borders, etc.
#3 Model layout and design
It is critical to structure a financial model in a logical, easy-to-follow design. This can be achieved by building the entire model on a single worksheet and using the group function to create sections.
It is also a good practice to use the same color theme throughout the whole model to make it professional-looking.
Pick a model that allows you to demonstrate some advanced financial modeling knowledge, but don’t be too ambitious so that you end up picking one that you are not familiar with. Make sure you know all the key steps to building the model thoroughly.
It is also a good idea to build a couple of models ahead of the interview so that they’ll be handy to show and demonstrate the process to the interviewer when this type of question is asked.
Below are some useful resources on different types of financial models:
There are two approaches to model building — making your model realistic, or keeping it simple and robust.
The first principles approach identifies various methods to model revenues with high degrees of detail and precision. There are also industry-specific considerations that need to be taken into account. For instance, when forecasting revenue for the retail industry, you forecast expansion rate and derive income per square meter. When forecasting revenue for the telecommunications industry, you predict the market size and use current market share and competitor analysis. When forecasting revenue for service industries, you estimate the headcount and use the income per employee trends.
On the other hand, the quick and simple approach to robust models outlines how you can model revenues in a much more straightforward way, with the benefit that the model will be more simple and easy to use. In this approach, you predict the future growth rate based on historical figures and trends.
The NPV function calculates the net present value, given a series of cash flows and a discount rate. The NPV function assumes that payments are spaced out in equal periodic payments.
The function argument is =NPV(rate, [value 1], [value 2],…), where rate is the rate of discount over the length of the period, and value 1, value 2,… are numeric values that represent a series of payments and income.
The XNPV function is far more precise than the NPV function because it takes into account the specific dates on which each of the cash flows takes place. This function requires the input of a discount rate, a series of cash flows, and a series of corresponding dates for each cash flow.
The function is =XNPV(Rate, Cash Flows, Dates of Cash Flow)
In valuing a security, investment, or company, the XNPV function provides a more accurate net present value because it factors in the time value of money, while NPV function does not.
Free cash flow to the firm (a.k.a. “unlevered free cash flow”) is the preferred approach when valuing equities using the DCF method.
The formula to calculate FCFF is: FCFF = EBIT x (1 – Tax%) + Depreciation & Amortization – Net Capital Expenditure – Increase in Working Capital
You can also calculate the free cash flow to equity, which is the amount of cash available to equity investors after paying off debt, interest, and investment required to keep the company operating.
It can be calculated using the formula: FCFE = Cash from operations – Capital Expenditures + Net Debt Issued
Sensitivity analysis is a tool used in financial modeling to analyze how different values of a set of independent variables impact a specific dependent variable under certain conditions. For example, a financial analyst may want to examine how a company’s profit margin may be impacted when variables such as the cost of goods sold and labor costs change. He can perform a sensitivity analysis to test different sets of values for these variables and see how the profit margin changes accordingly.
One of the most useful tools in Excel for performing sensitivity analysis is the data tables, where you can show the output sensitivity by changing up to two independent variables. Tornado charts are also a great way of showing the impact of changes to many variables at once.
If you get one of the financial modeling interview questions along the lines of, “How are the 3 financial statements linked together?”, in an interview, you shouldn’t go into as much detail as above, but instead simply hit the main points, which are:
#1 Model structure — By separating inputs (constants only) from processing and outputs (formulas only), you can easily track the source of inputs and ensure that assumptions are consistent (assumptions should be entered once only).
#2 Go to special — The Go to special function in Excel allows you to highlight cells containing specific content, such as constants, formulas, and text. This helps you check whether all inputs are constants and all outputs are formulas.
#3 Trace precedents and dependents — Tracing precedents identifies what precedes the cell you would like to check (i.e., check which inputs are used in a formula) while tracing dependents identifies where an input cell flows into (i.e., which formulas use that input).
Thank you for reading CFI’s guide to financial modeling interview questions and answers. We’ve also published numerous other interview guides. The best way to be good at interviews is to practice, so we recommend reading the most common questions and answers below to be sure you’re prepared for anything!
Here are our most popular interview guides (questions and answers):


